The Dashboard Page
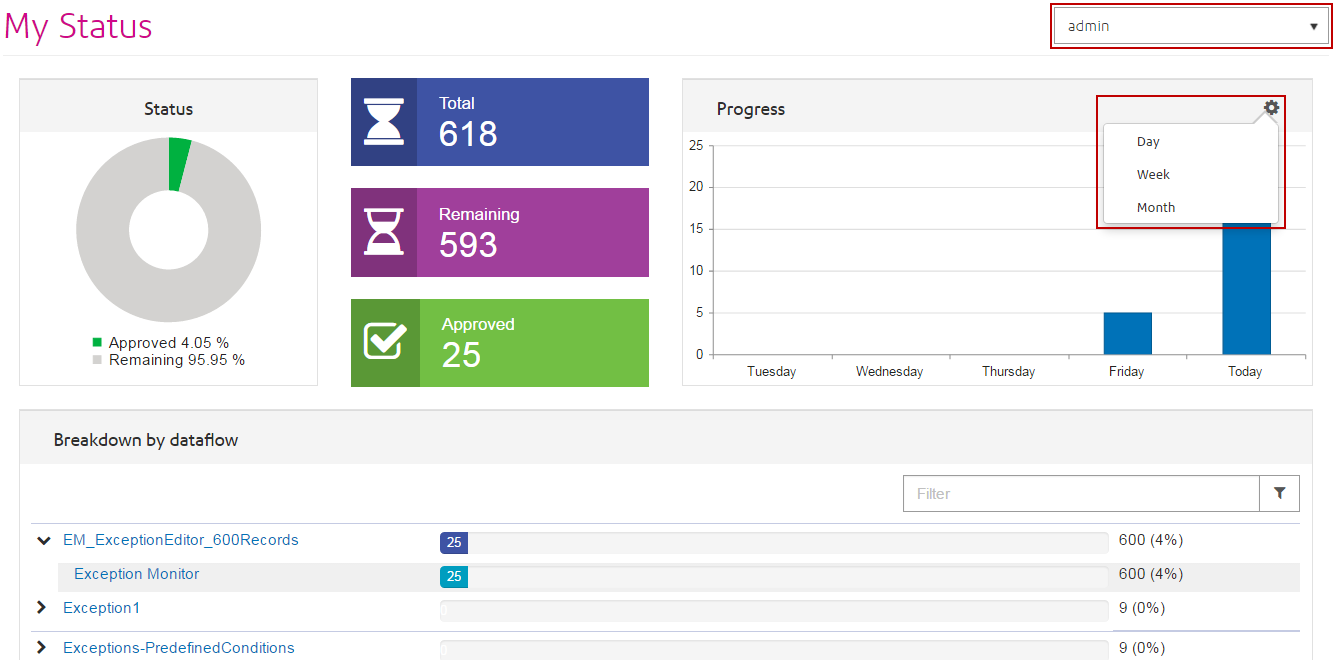
The Exceptions Dashboard displays data that summarizes the status of exception records
belonging to you and other users. (Note that you can only view others' data if you
have modify permissions.) This includes the following:
- The total number of exceptions
- The number and percentage of exceptions that have been approved versus those that remain unapproved
- The selected user's progress each day, week, or month
- Exception record approval progress by dataflow and stage(s) within the dataflow
Note: The progress charts for user and dataflow will not appear if you have
turned off progress tracking on the Business Steward Settings page of Management
Console.
-
From the Dashboard tab, select the user whose exception activity you would like
to view in the first drop-down box highlighted below. Note that only users who
currently have exceptions assigned to them will appear in this list.