Viewing a Summary of Match Results
The Match Analysis tool can display summary information about the matching processes in a dataflow, such as the number of duplicate records, the average match score, and so on. You can view the results of a single job or you can compare results between multiple jobs.
The Summary tab lists matching statistics for the job. Depending on the type of matching stage used in the dataflow, you will see different information.
For Intraflow Match you will see the following summary information:
- Input Records
- The total number of records processed by the matcher stage.
- Unique Records
- A suspect or candidate record that does not match any other records in a match group. If it is the only record in a match group, a suspect is automatically unique.
- Match Groups
- (Group By) Records grouped together either by a match key or a sliding window.
- Duplicate Collections
- A duplicate collection consists of a Suspect and its Duplicate records grouped together by a CollectionNumber. Unique records always belong to CollectionNumber 0.
- Express Matches
- An express match is made when a suspect and candidate have an exact match on the contents of a designated field, usually an ExpressMatchKey provided by the Match Key Generator. If an Express Match is made no further processing is done to determine if the suspect and candidate are duplicates.
- Average Score
- The average match score of all duplicates. The possible values are 0-100, with 0 indicating a poor match and 100 indicating an exact match.
For Interflow Match you will see the following summary information:
- Duplicate Collections
- A duplicate collection consists of a Suspect and its Duplicate records grouped together by a CollectionNumber. Unique records always belong to CollectionNumber 0.
- Express Matches
- An express match is made when a suspect and candidate have an exact match on the contents of a designated field, usually an ExpressMatchKey provided by the Match Key Generator. If an Express Match is made no further processing is done to determine if the suspect and candidate are duplicates.
- Average Score
- The average match score of all duplicates. The possible values are 0-100, with 0 indicating a poor match and 100 indicating an exact match.
- Input Suspects
- The number of records in the input stream that the matcher tried to match to other records.
- Suspects with Duplicates
- The number of input suspects that matched at least one candidate record.
- Unique Suspects
- The number of input suspects that did not match any candidate records.
- Suspects with Candidates
- The number of input suspects that had at least one candidate record in its match group and therefore had at least one match attempt.
- Suspects without Candidates
- The number of input suspects that had no candidate records in its match group and therefore had no match attempts.
For Transactional Match, you will see the following summary information:
- Average Score
- The average match score of all duplicates. The possible values are 0-100, with 0 indicating a poor match and 100 indicating an exact match.
- Input Suspects
- The number of records in the input stream that the matcher tried to match to other records.
- Suspects with Duplicates
- The number of input suspects that matched at least one candidate record.
- Unique Suspects
- The number of input suspects that did not match any candidate records.
- Suspects with Candidates
- The number of input suspects that had at least one candidate record in its match group and therefore had at least one match attempt.
- Suspects without Candidates
- The number of input suspects that had no candidate records in its match group and therefore had no match attempts.
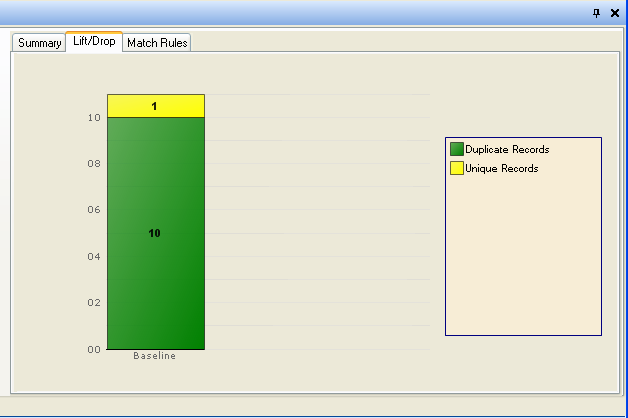
The Lift/Drop tab of the Match Analysis tool displays duplicate and unique record counts in a bar chart for the selected baseline and, optionally, comparison results. Lift is the increase in the number of duplicate records. Drop is the decrease in the number of duplicate records. Unique records are shown in yellow and duplicate records are shown in green.
If only a baseline job is selected, the chart will show the results for that one job:
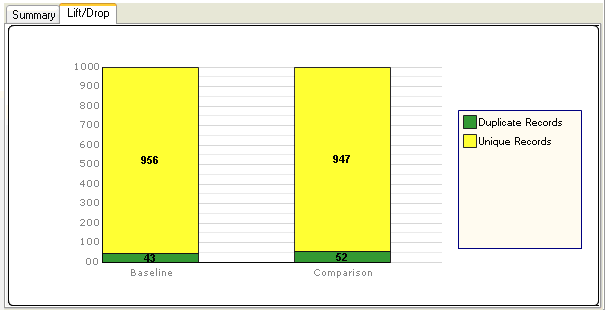
If both a baseline and a comparison job are selected, a chart for the baseline and comparison jobs are shown side by side:
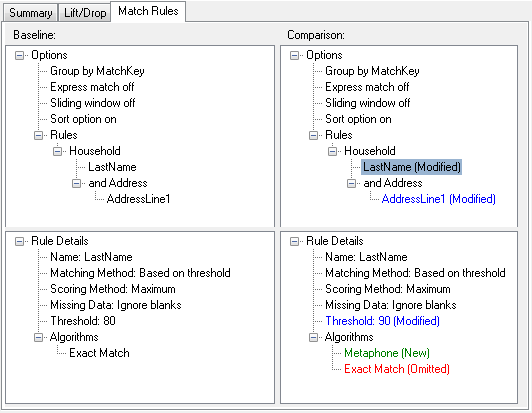
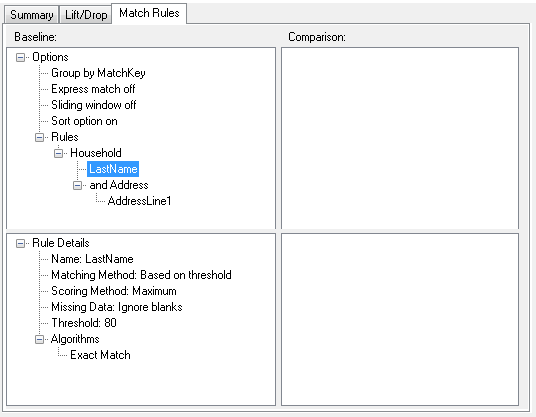
The Match Rules tab of the Match Analysis tool displays the match rules used for a single match result or the changes made to the match rules when comparing two match results.
Match rules are displayed in a hierarchical structure similar to how they are displayed in the stage in which they were created. The rule hierarchy contains two nodes: Options and Rules. The Options node shows the stage settings for the selected match result. The Rules node shows the match rules for the selected match result.
To view rule details, select a node in the hierarchy.
If you are comparing match rules between multiple jobs, differences between the baseline and comparison match results are color coded as follows:
- Blue
- Indicates that the match rule in the comparison match result was modified.
- Green
- Indicates that the match rule in the comparison match result was added.
- Red
- Indicates that the match rule in the comparison match result was omitted.
For example: