Creating a Pivot Table
A pivot table summarizes data for easier analysis by creating table row and column categories based on input data. For more information, see Pivot Tables.
In the Group Statistics stage options:The names of these output columns follow the naming convention
<Data>_<Operation>Of<InputFieldName>, where
<Data> is the value you specified in the first field,
<Operation> is the operation you selected in the
Operation field, and <InputFieldName>
is input column on which the operation is performed.
Pivot Table Example
The input data which shows shipping information from the fulfillment department:
Region,State,County,ShipDate,Unit
East,MD,Calvert,1/31/2010,
East,MD,Calvert,6/31/2010,212
East,MD,Calvert,1/31/2010,633
East,MD,Calvert,6/31/2010,234
East,MD,Prince Georges,2/25/2010,112
East,MD,Montgomery,1/31/2010,120
East,MD,Baltimore,6/31/2010,210
East,VA,Fairfax,1/31/2010,710
West,CA,SanJose,1/31/2010,191
West,CA,Alameda,2/25/2010,411
West,CA,Los Angeles,2/25/2010,
West,CA,Los Angeles,2/25/2010,215
West,CA,Los Angeles,6/31/2010,615
West,CA,Los Angeles,6/31/2010,727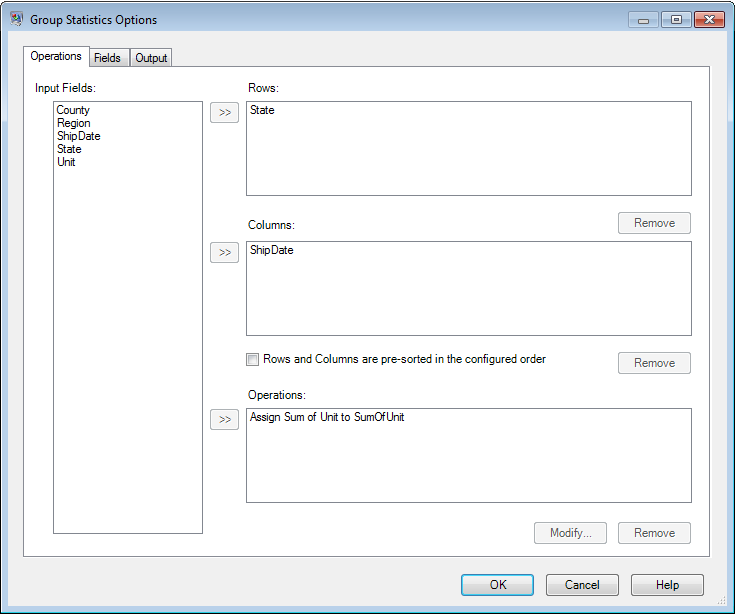
In the Fields tab of the stage options, add the exact dates in the grid that appear in the
ShipDate field of the dataflow's input data, and select the
Operation values to be displayed for each of these column
values.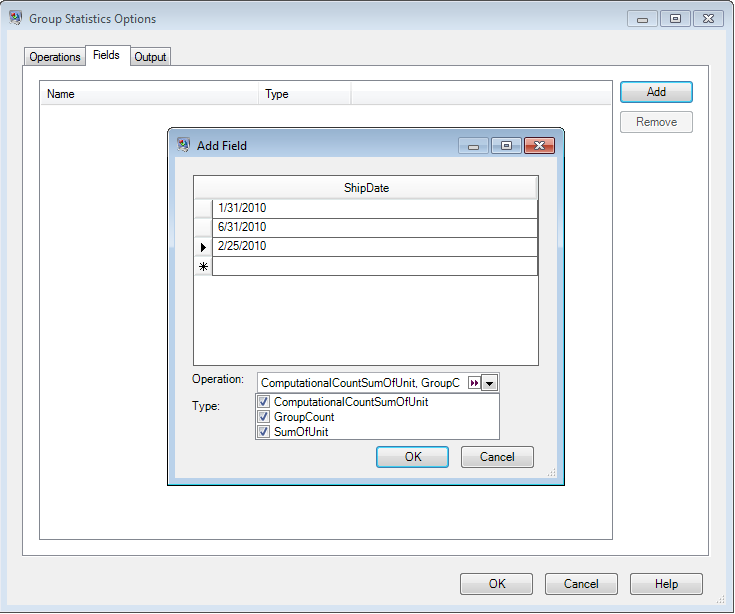
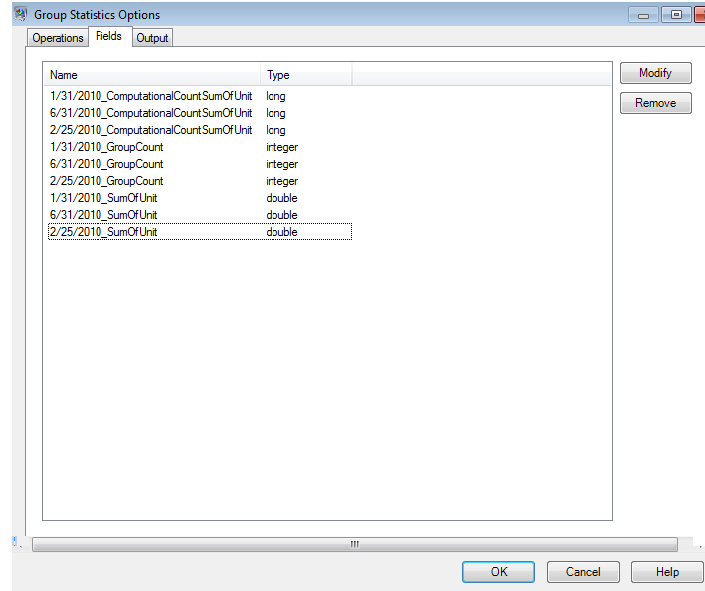
On clicking OK in the Add Field window, the output columns to be created are automatically listed in the Fields tab. These output columns are a cartesian product of the exact input values and the operations you selected in the Add Field window.
Output
State,1/31/2010_GroupCount,1/31/2010_ComputationalCountSumOfUnit,
1/31/2010_SumOfUnit,2/25/2010_GroupCount,2/25/2010_ComputationalCountSumOfUnit,
2/25/2010_SumOfUnit,6/31/2010_GroupCount,6/31/2010_ComputationalCountSumOfUnit,
6/31/2010_SumOfUnit
VA,1,1,710,,,,,,
CA,1,1,191,3,2,626,2,2,1342
MD,3,2,753,1,1,112,3,3,656