Output Columns
| Field Name | Description / Valid Values |
|---|---|
|
<Operation>Of<InputFieldName> |
Contains the result of a calculation. Group Statistics creates one output field per
operation and names the field based on the operation and field.
For example, the default field name for a |
|
<Value>_<Operation> |
Contains the result of a pivot, where |
|
GroupCount |
Indicates the number of records in the group. |
|
GroupID |
A unique number assigned to each group sequentially. The first group has a GroupID value of 1, the second has a value of 2, and so on. |
| ComputationalCount<Operation> Of<InputFieldName> | Indicates the actual number of records in a group on which the
operation is performed. For example, for the operation
|
|
Status |
Reports the success or failure of the Group Statistics calculations.
|
|
Status.Code |
Reason for failure, if there is one. The status codes available are:
|
|
Status.Description |
A verbose description of the error.
|
Group Statistics Example
This input data shows the number of customers you have in certain counties. The data also shows the U.S. state in which the county is located (MD, VA, CA, and NV), as well as the region (East or West). The first row is a header record.
Region|State|County|Customers
East|MD|Calvert|25
East|MD|Calvert|30
East|MD|Prince Georges|30
East|MD|Montgomery|20
East|MD|Baltimore|25
East|VA|Fairfax|45
East|VA|Clarke|35
West|CA|Alameda|74
West|CA|Los Angeles|26
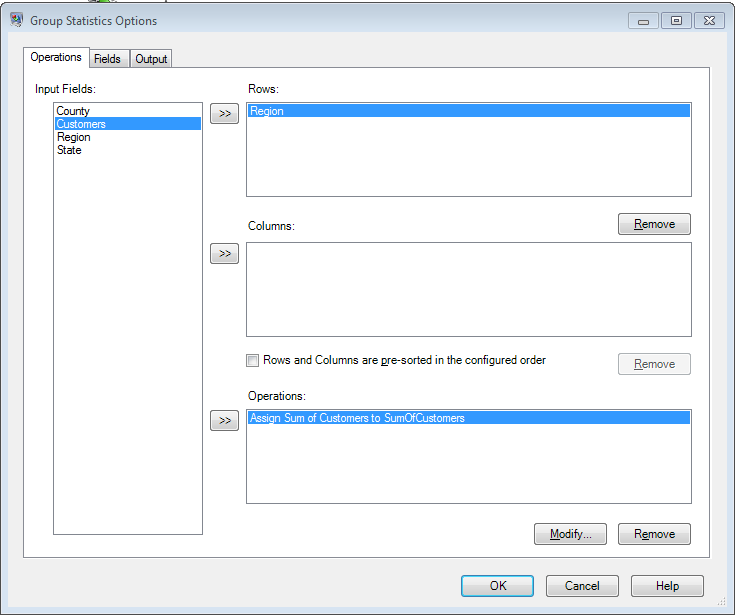
West|NV|Washoe|22If you wanted to calculate the total number of customers for each region, you would define the
Region field as a row in the Operations tab. For the
operation, you would perform a sum operation on the Customers field.
The result:
Region|SumOfCustomers
    East|210.0
West|122.0For more information about creating a pivot table, see Creating a Pivot Table.