The Dashboard Page
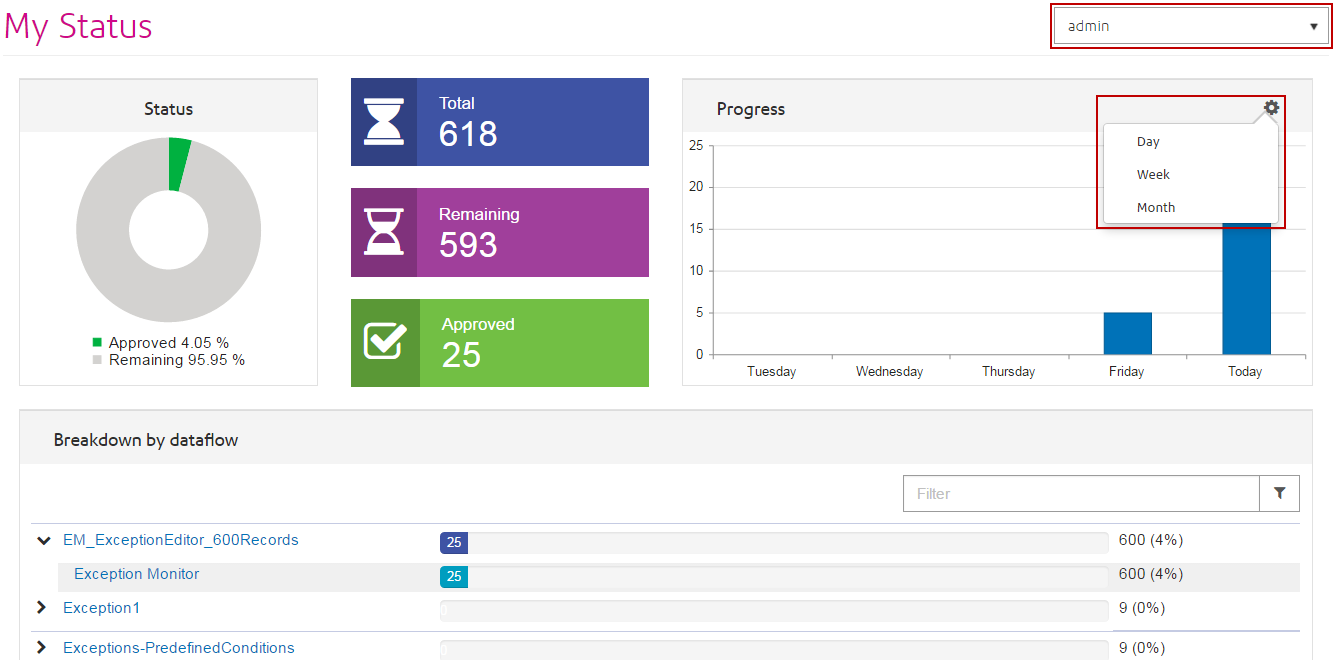
The Exceptions Dashboard displays data that summarizes the status of exception records belonging to you and other users.
Note: You can only view others' data if you have modify permissions.
Status data includes the following:
- The total number of exceptions
- The number and percentage of exceptions that have been approved versus those that remain unapproved
- The selected user's progress each day, week, or month
- Exception record approval progress by dataflow and stages within the dataflow
Note: The progress charts for user and dataflow will not appear if you have
turned off progress tracking on the Business Steward Settings page of Management
Console.
-
On the Dashboard tab, select the user whose exception
activity you would like to view in the first drop-down box highlighted
below.
Note: Only users who currently have exceptions assigned to them will appear in this list.