A First Look at Metadata Insights
Metadata Insights gives you the control you need to deliver accurate and timely data-driven insights to your business. Use Metadata Insights to develop data models, view the flow of data from source to business application, and assess the quality of your data through profiling. With this insight, you can identify the data resources to use to answer particular business questions, adapt and optimize processes to improve the usefulness and consistency of data across your business, and troubleshoot data issues.
To access Metadata Insights, open a web browser and go to:
http://server:port/metadata-insights
Where server is the server name or IP address of your Spectrum™ Technology Platform server and port is the HTTP port. By default, the HTTP port is 8080.
Metadata Insights functions are divided into these areas: discovery, modeling, profiling, and lineage and impact analysis.
Discovery
Metadata gives a context to the associated data and improves its understanding. It helps organizations take informed decisions. That is the reason most of the data driven organizations are moving towards metadata management.
- Better understanding of the business data, its creation, manipulation, and the business rules associated with it.
- Ease in locating specific data in varied data set across the organization
- Tracking data upstream and downstream to know how a change impacts the link and workflow
- Ensuring data quality: Since metadata defines data, managing it correctly ascertains data correctness and consistency. It is the key to identifying malformed data and preventing database integrity issues.
How Discovery helps you manage metadata
The Discover dashboard of Metadata Insights gives you a unified view of all your configured connections. You can discover the assets from all the connections and perform these tasks on the discovered metadata:
- Search for specific assets (table, column, or view) in your discovered connections.
- Add tags to assets to give those a relevant context and make those easily accessible later.
Define Glossary
For data to make sense in an organizational context, it needs to be consistent, contextual, and transparent. Users through the organization need to have a common understanding of the definition and lineage of the data they are using. And what can be a better way to achieve this than arriving at the definitions, policies, and rules governing data collaboratively through work flows and multilevel approvals.
- Ease of use: Business Glossary helps you search for the required data without having to master the tables, column names, fields, and metadata.
- Transparency: The data comes with its full context and lineage, so you can trust it without an iota of doubt.
- Removes conflicts, confusions: You have a comprehensive view of all the business terms with the related data and metadata. This avoids all the conflicts in terms of meaning and its usage.
- Swift, powerful, simple search: The advanced search features make searching swift, simple, and powerful. You can use any aspect of the data including relationship, tags, and attribute to search it.
These powerful features of Define Glossary make it most suitable for your business needs if you deal with data, and inconsistency in its definition across the enterprise is hindering you. If you are not able to find the right data, at the right time, and reconciling the differences in data definition in various departments is making life chaotic for you, ultimately eroding the trust in your data.
Modeling
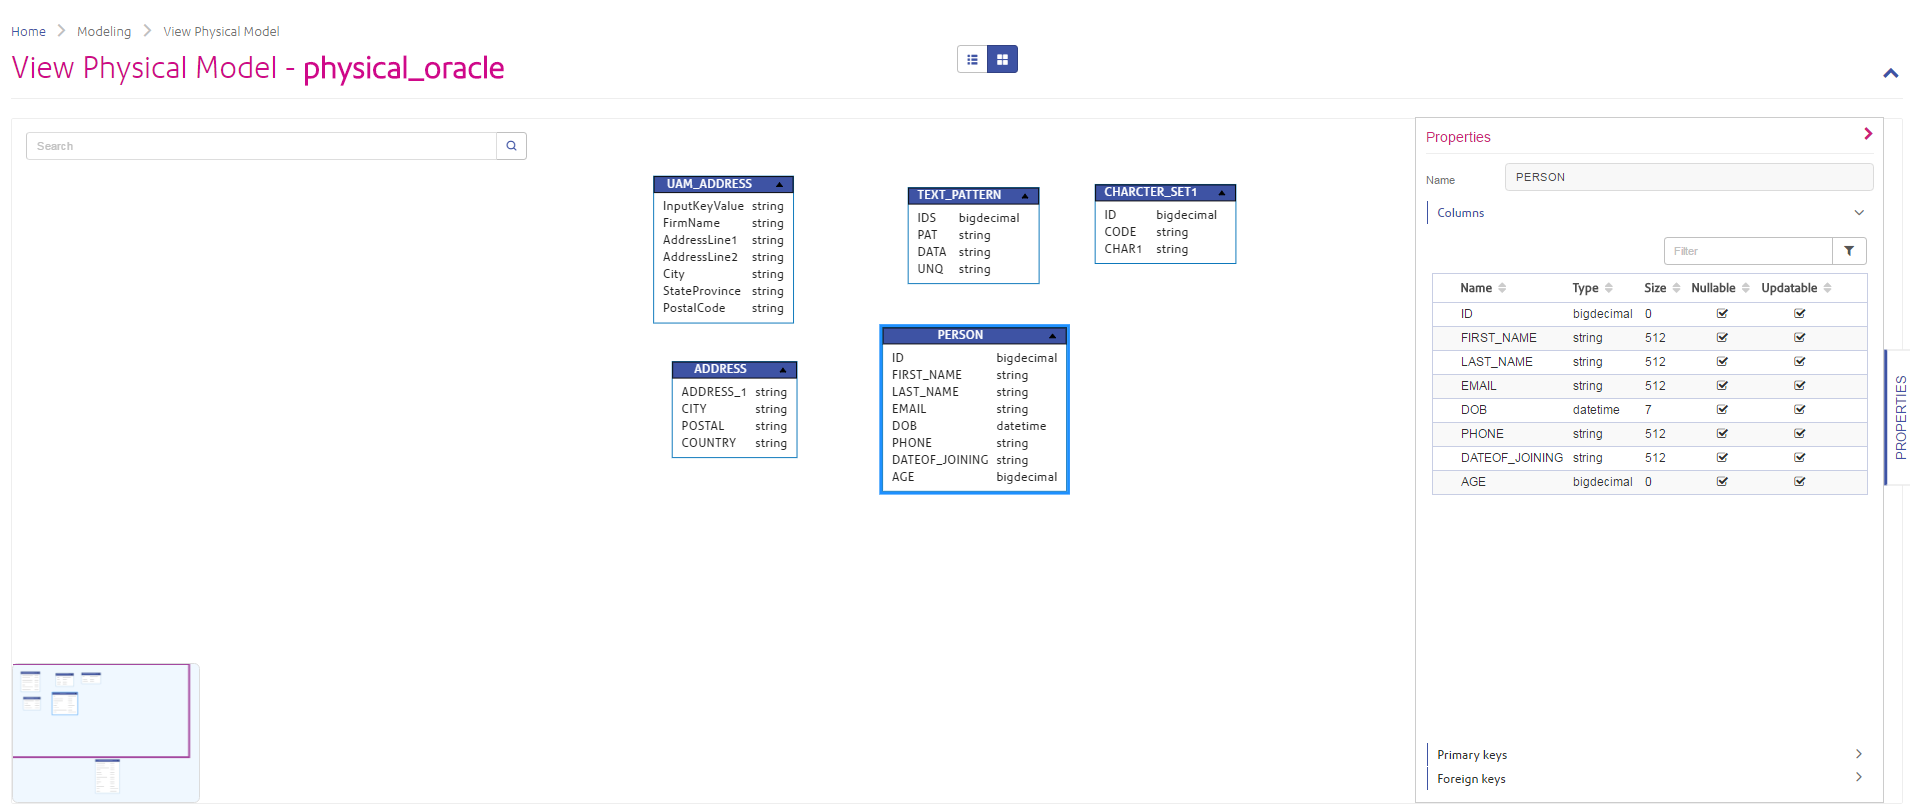
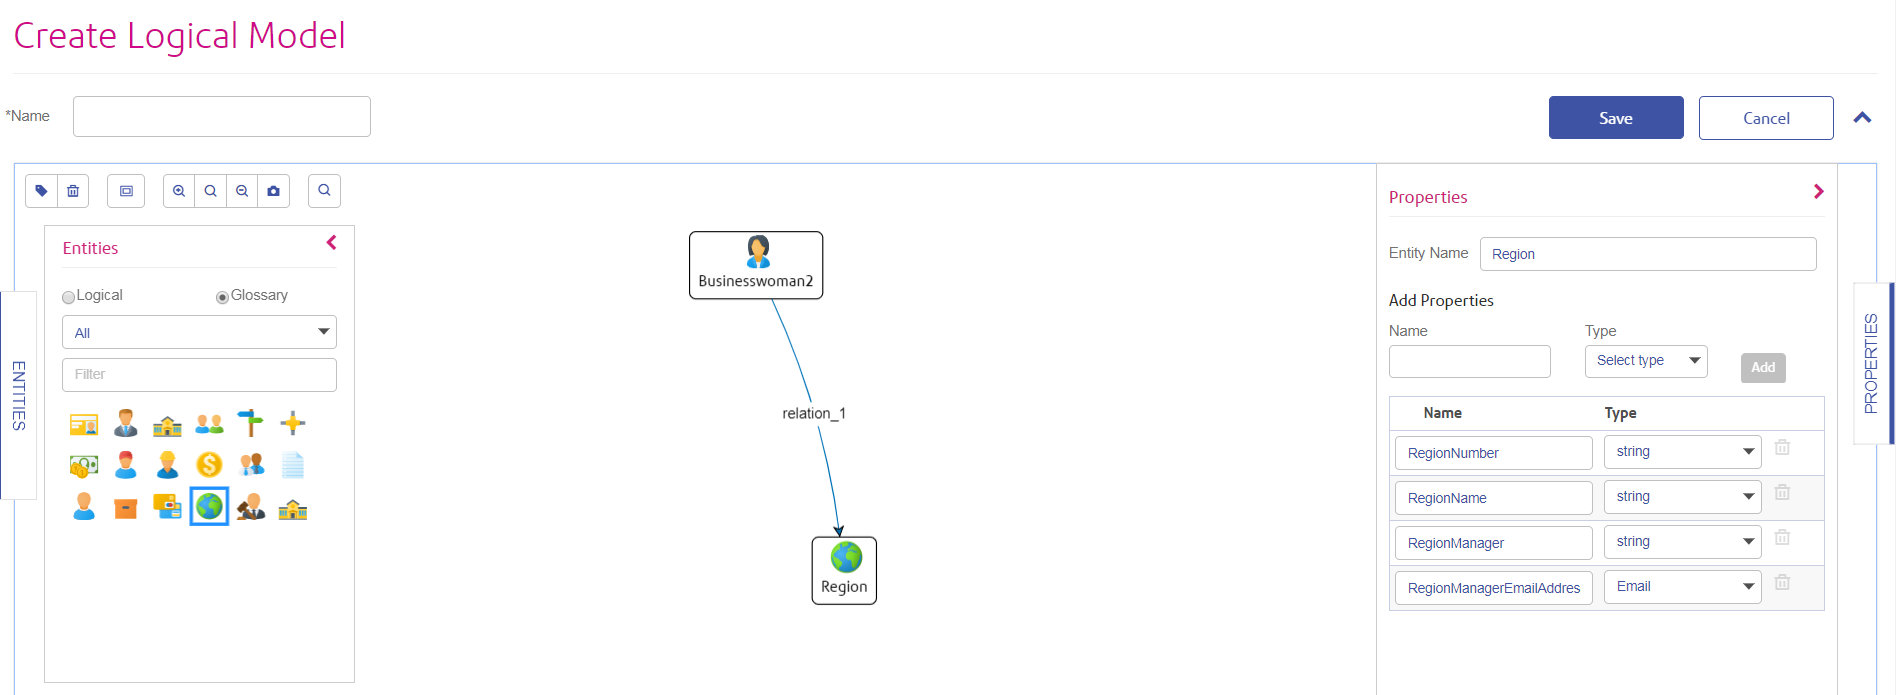
The Modeling view is where you create physical and logical data models and deploy those into a model store, thus creating a layer of abstraction over the underlying data sources on the Spectrum™ Technology Platform server.
A physical model organizes your organization's data assets in a meaningful way. A physical model makes it possible to pull data from individual tables, columns, and views to create a single resource that you can then use to supply data to logical models or to perform profiling.
A logical model defines the objects that your business is interested in and the attributes of those objects, as well as how objects are related to each other. For example, a logical model for a customer might contain attributes for name and date of birth. It might also have a relationship to a home address object, which contains attributes for address lines, city, and postal code. Once you have defined the attributes of the objects your business is interested in, you can map physical data sources to the logical model's attributes, thereby identifying the specific data asset that will be used to populate that attribute.
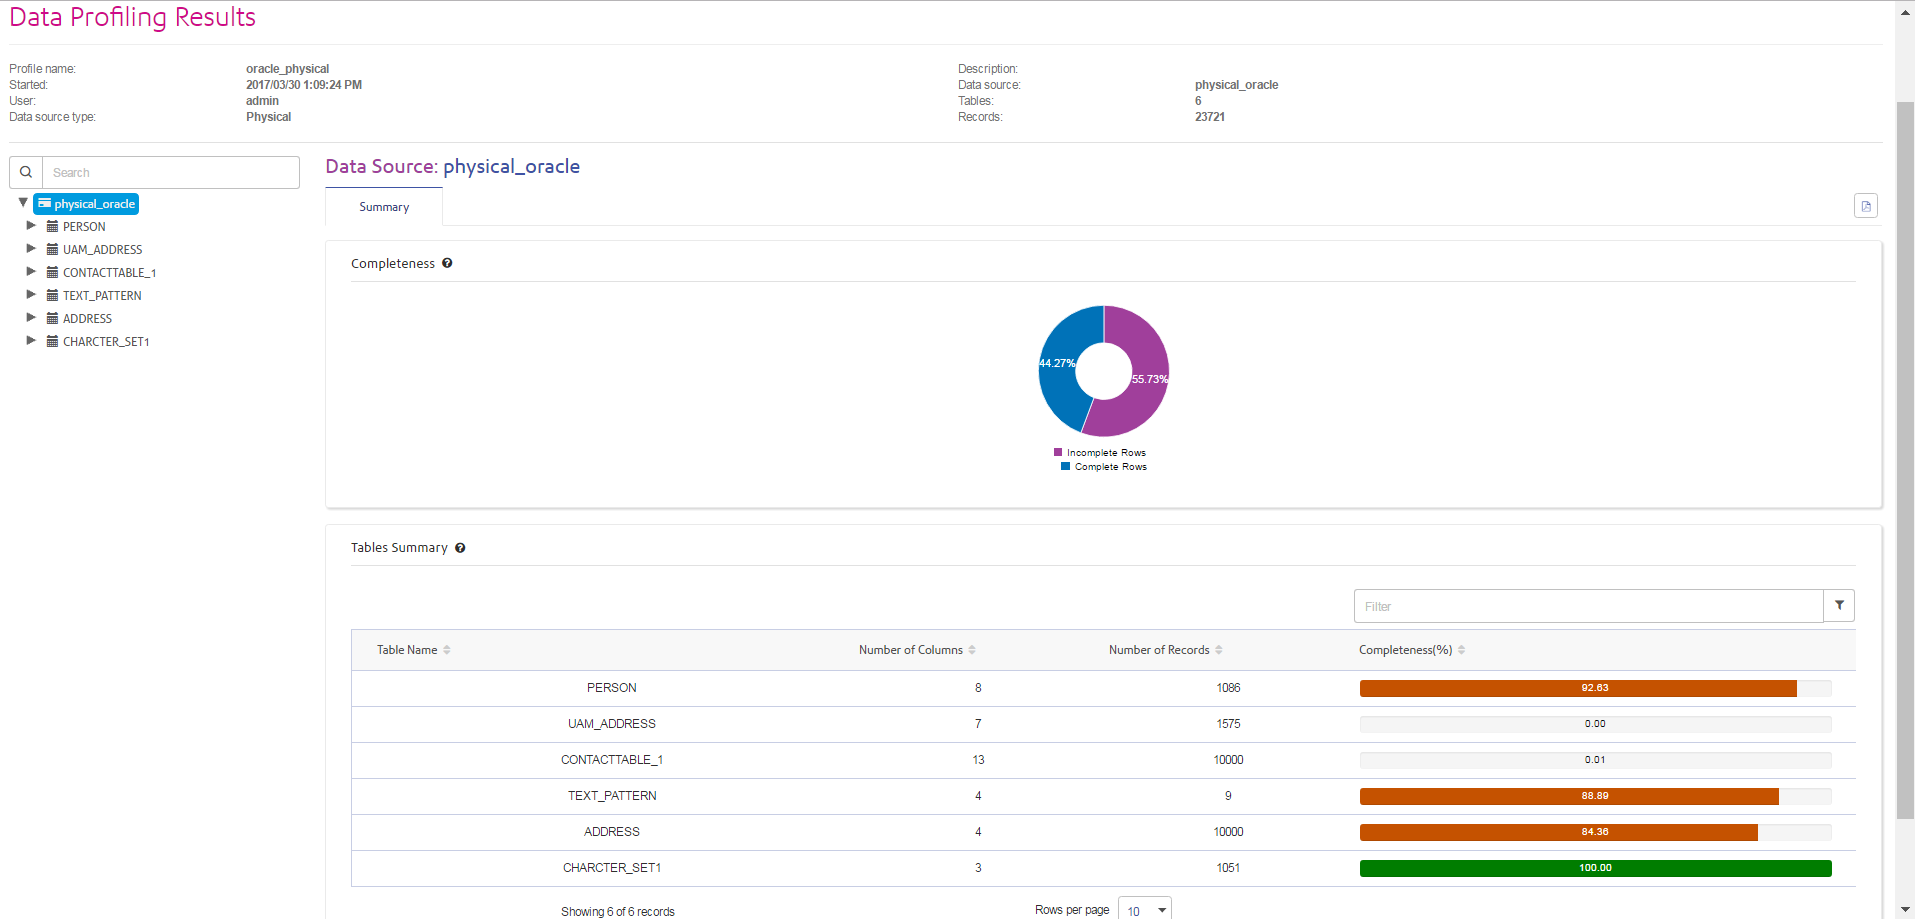
Profiling
Data profiling scans your data records from all the data sources - irrespective of its volume and complexity. It identifies problems related to correctness, completeness, and validity in the data, and suggests actions to fix the issues. Thus, it improves the quality and utility of your data with very little manual effort.
Benefits of data profiling- It is the first step in analyzing your data and predicting how much effort is needed to make it usable
- It improves your trust on the data set you have
- It is one of the mandatory steps for taking control of your organizational data and using it across the enterprise.
Scorecard
Monitoring is one of the indispensable aspects of data governance and good decision making. Constant monitoring of data quality helps you to take measures to improve the consistency, reliability, and accuracy of your data. Scorecards help you measure the quality of your data and assign score cards to it by tracking key matrices defined by you. It represents your data health in a graphical form, making assessment all the more easy and swift for you.Trends
Trends help you measure the improvement in the quality of your data over a period of time. For example, in a merger between two companies (Company A and Company B), company A needs to migrate customer data in its system from company B. It will run a scorecard on the data at the beginning of the process to see the quality and may thereafter do this scoring after every cleansing. Trends plot a chart based on your recent runs or for a specified date range to give you a clearer picture on the improvement index.
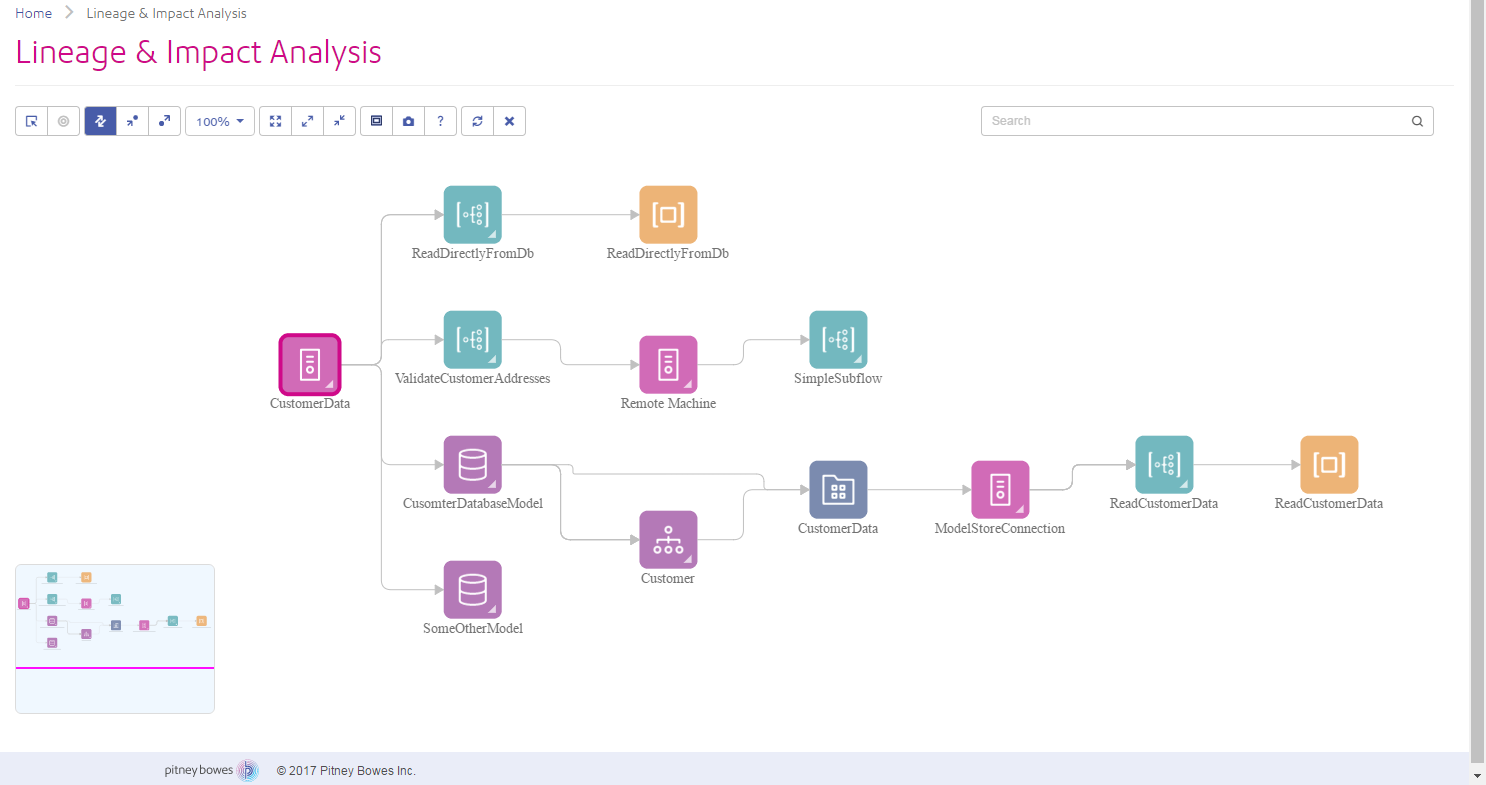
Lineage and Impact Analysis
The Lineage and Impact Analysis view shows how data flows from data sources to data destinations and through Spectrum™ Technology Platform flows. Lineage and impact analysis are similar concepts that describe different ways of tracing the flow of data.
Lineage shows where data comes from. You can use it to trace the path of data back to its source, showing all the systems that process and store the data along the way, such as Spectrum™ Technology Platform flows, databases, and files.
Impact analysis shows where data goes and the systems that depend on data from a selected data resource. You can use it to view the flows, databases, and files that use a data resource directly or indirectly. Looking at impact analysis is useful if you want to understand how a modification to a database, file, or flow will affect the processes and systems that use the data.
Metadata Insights can show lineage and impact analysis in a single diagram that shows the complete flow of data from source to destination. You can also choose to view lineage only or impact only. By viewing data lineage and impact analysis together you can pinpoint issues in your data processes and plan for upgrades and modifications to your data processes.