JMX Performance Monitor Statistics
The Spectrum JMX Console's Performance Monitor Manager displays statistics about the performance of different parts of a dataflow execution, including the overall execution time, throughput, and execution time of individual stages. The statistics are reported in a semicolon-delimited format:
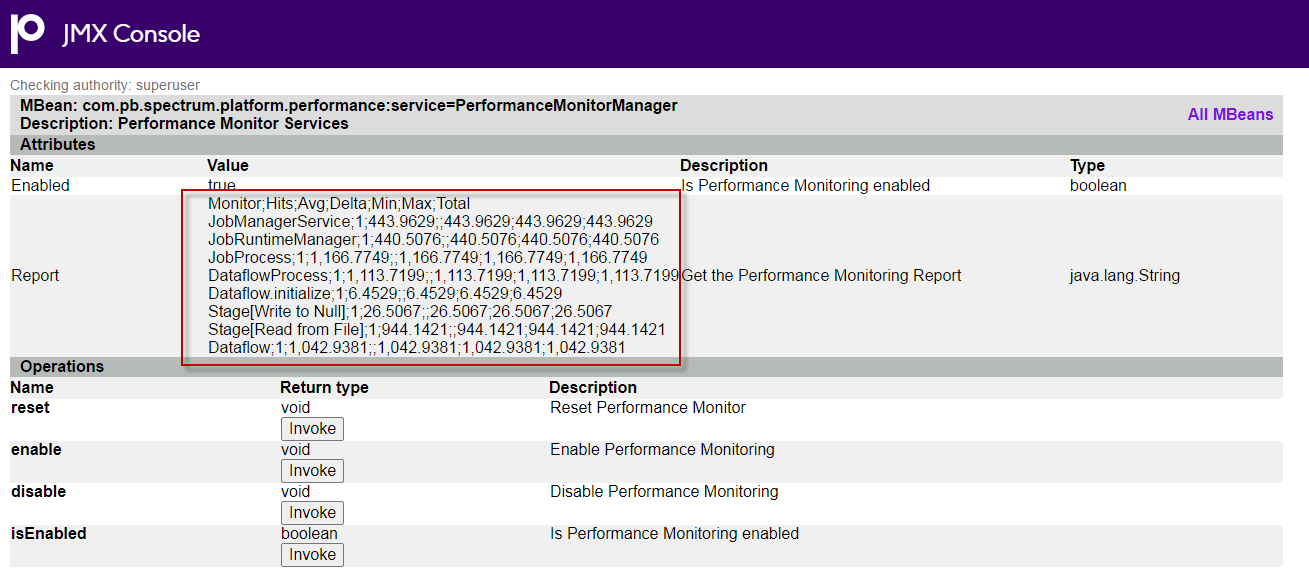
Tip: Put the data into a spreadsheet for easier viewing.
The first row is a header record consisting of the following columns:
- Monitor
- The item whose performance is being measured.
- Hits
- The number of times the item was run.
- Avg
- The average amount of time that the item spent processing a request, in milliseconds.
- Delta
- This statistic is not used.
- Min
- The shortest amount time that the item spent processing a request, in milliseconds.
- Max
- The longest amount of time that the item spent processing a request, in milliseconds.
- Total
- The total time spent processing, in milliseconds.
The most important items to review are the following.
- Dataflow
- The overall data flow response times and throughput.
- ServiceRuntimeManager.borrow.DataflowName
- Response time for handling concurrent requests, in milliseconds. This response time may be improved by modifying the dataflow pool size.
- RemoteComponent.borrow.RemoteComponentName
- Database resource performance directly impacted by the database resource pool size. This response time may go up as you increase your dataflow pool size. If this number increases to something significant such as ½ a millisecond increase the database resource pool size.
- Stage[StageName]
- The response times for each stage. This can help you identify bottleneck stages that are taking significantly longer to process than other stages. Bottleneck stages can potentially be addressed by changing how the functionality in the existing stage is implemented and/or by increasing the runtime instances for that stage.