Toolbar and controls (Edit Job page)
Home button and flow name
These items display at the top left corner of the page and support these tasks:
| Return to the Explorer page button |
|
| The current flow name appears next to the Return to Explorer button |
 |
Application toolbar
The Application toolbar is at the top right corner of the page and supports these
tasks:
| Enter full screen mode | |
| Access help resources: View documentation, View the keyboard shortcuts reference, or contact Precisely support. | |
| Sign out of Flow Designer (click ) |
Canvas task buttons
The canvas task buttons allow you to interact with the workflow space.
| Open the New Flow page to select a flow, job, or service to add to the flow currently displayed on the canvas. | |
| Open the Explorer page, and display the flow list to select and open one of the available flows. | |
| Save the flow displayed on the canvas. | |
Select a Save method:
|
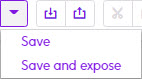 |
| Import a flow | |
| Export a flow | |
| Undo the last action (maximum 100) | |
| Repeat the last action | |
| Cut the selected item from the canvas | |
| Copy the selected item to the clipboard | |
| Paste the item on the clipboard to the canvas | |
| Permanently delete the selected item | |
| Select the workflow canvas display size as a percentage of the actual size | 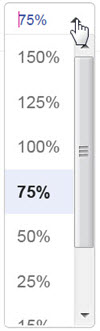 |
| Fit the canvas display to the page (screen) | |
| Run the flow that is currently displayed | |
| Toggle the grid line display | |
| Toggle overview display: Click to open a small overview display that shows you the current focus of a workflow display. This is useful for larger, complicated workflows. | |
| Refresh the current display | |
| Close the flow: This prompts to save changes. |
Panel display and view settings
These controls change the display of the palette panel.
| Show the Validation Errors panel or Hide the Validation Errors panel. This panel evaluates the accuracy of the flow on the canvas and reports the errors in a concise view. The errors will contain the stage and a description of the error. | |
| Show the Inspection panel or Hide the Inspection panel. This panel provides a brief but expandable view of the selected items. | |
| Show the Execution History panel or hide the Execution History panel. This panel provides a quick way for you to run flows and obtain processing results. |
Filter
| Immediately below the palette view settings is the filter entry box. You can narrow the stages displayed by entering a string, such as "read," and see only the stages containing that description. |
Palette display and view settings
The palette has a robust set of display settings that you can change as needed.
| Toggle to hide or show the palette panel (CTRL+C) | |
| List mode display - lists all of the stages available in a compact view with small icons. With this view, you can quickly scan available stages. | |
| Icon mode – lists all of the stages with larger icons. Since this display emphasizes icons, more scrolling is required to see all the stages in a grouping. | |
| Expand all – shows all of the stages in all groupings as indicated by the selected (List or Icon) display mode. | |
| Collapse all – Shows a list of available Sources, Sinks, and Control stages, deployable modules, and user-defined stages in a list format. Click on any label to expand the display and see the stages under each label as indicated by the selected (List or Icon) display mode. |
Stages
The palette shows the stages you can apply to your flows.