Use the inspection tool to view how input data is transformed and processed at any point
in a flow.
Note: For the preview version of Flow Designer, note these inspection limitations:
This version supports single-point inspection. You cannot add multiple
inspection points.
Inspection is available for jobs, only. Flow Designer does not support for
services.
The input files must reside on the Spectrum server: Flow Designer does not
support the inspection of local files at this time.
Inspection points provide a processing snapshot at any point in a flow.
Inspection points allow you to confirm that the flow is producing the results you
want, isolating problems, and identifying records that contain errors. The scenario
below shows how to inspect data conversion of mapped fields during processing.
To add inspection points to your flow:
Open a flow containing an input file that resides on the server.
Perform a high-level check of the flow.
Are input and output fields mapped? Field mapping is indicated by a dot
(node) on the channel between any two stages.
You can hover over the mapping indicator to see the mapping that is taking
place at that point in the flow.
Double-click the channel with the node, and it turns blue. Click that same channel once
more to display the Mapping options page. Learn more about field mapping
here: View mapping details.
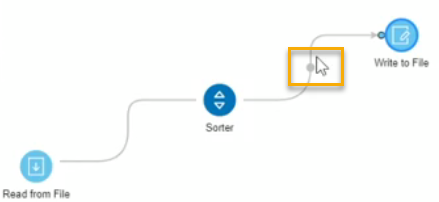
Click at any section along the channel to see how the data will change for
mapped fields during processing. Data changes include transforms, such as
data type conversions. Flow Designer displays a hover message to provide
that information.
To more closely inspect any point in the flow, right-click on a channel in the
position where you will perform the inspection.
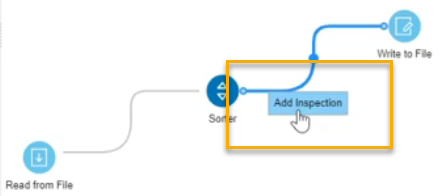
Click again to insert the inspection point. Notice that this first inspection
point occurs before the data conversion, to the left of the mapping indicator.
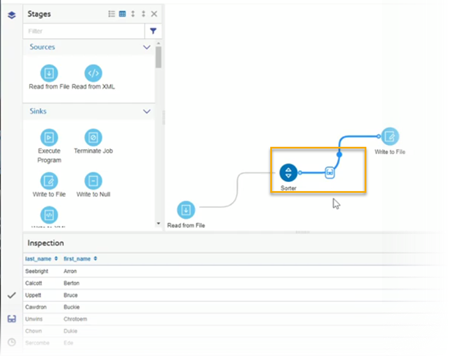
Flow designer adds an eyeglass icon indicating the inspection point and displays
the Inspection details panel at the bottom of the page.The inspection panel includes controls
that refresh, collapse all, and expand all contents, and close the panel. If
your input contains hierarchical data, you can extend the display to see
parent-child data relationships. You can sort data by clicking any column. The
sort order changes as you click on the column name.
When you add the
inspection point, Flow Designer runs the job to produce a snapshot of that
inspection point. You will see the data as it relates to that specific
processing point. The preview provides a picture of how the data conversion
takes place during the different phases of processing.
To see the state of the data after mapping/conversion, place an inspection point
on the other side of the mapping indicator.
Note: Changing the inspection point
removes the previous inspection point. If you remove the inspection point, Flow
Designer displays a message: There are no inspection points yet. Add an
inspection point on a channel to view inspection data.
Once again, Flow Designer runs the job to take a snapshot of the data.
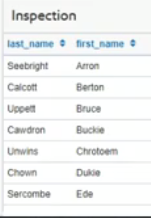
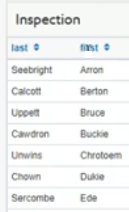
Observe the difference in field names this example, of the data before
conversion and after conversion:
First inspection point, before processing
Second inspection point, post-conversion
Note: Right-click on any inspection point to delete it. You can
also right-click on any point of the channel containing the inspection point to
delete it. When you delete an inspection point, Flow Designer closes the
inspection details panel.
 that refresh, collapse all, and expand all contents, and close the panel. If
your input contains hierarchical data, you can extend the display to see
parent-child data relationships. You can sort data by clicking any column. The
sort order changes as you click on the column name.
that refresh, collapse all, and expand all contents, and close the panel. If
your input contains hierarchical data, you can extend the display to see
parent-child data relationships. You can sort data by clicking any column. The
sort order changes as you click on the column name.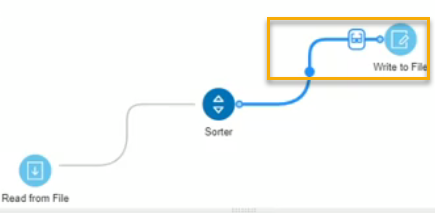
 Note: Right-click on any inspection point to delete it. You can also right-click on any point of the channel containing the inspection point to delete it. When you delete an inspection point, Flow Designer closes the inspection details panel.