complexType Graduation
diagram mapping_p182.png
namespace http://www.mapinfo.com/midev/service/mapping/v1
children tns:ValueAtSize
used by
elements BarLayer/Graduation PieLayer/Graduation
attributes
Name  Type  Use  Default  Fixed  Annotation
graduationMethod  tns:GraduationMethod    SQUARE_ROOT    
documentation
Describes the way the size of the graduated pie chart is calculated.
annotation
documentation
Represents bar/pie graduation.

attribute Graduation/@graduationMethod
type tns:GraduationMethod
properties
default SQUARE_ROOT
facets
Kind Value Annotation
enumeration SQUARE_ROOT
documentation
A symbol that is 40 pixels high at value 100 will be about 12 pixels high at value 10.
enumeration LOGARITHM
documentation
A symbol that is 40 pixels high at value 100 will be 20 pixels high at value 10.
enumeration CONSTANT
documentation
A symbol that is 40 pixels high at value 100 will be 4 pixels high at value 10.
annotation
documentation
Describes the way the size of the graduated pie chart is calculated.

element Graduation/ValueAtSize
diagram mapping_p183.png
namespace http://www.mapinfo.com/midev/service/mapping/v1
type xsd:double
properties
minOcc 0
maxOcc 1
content simple
annotation
documentation

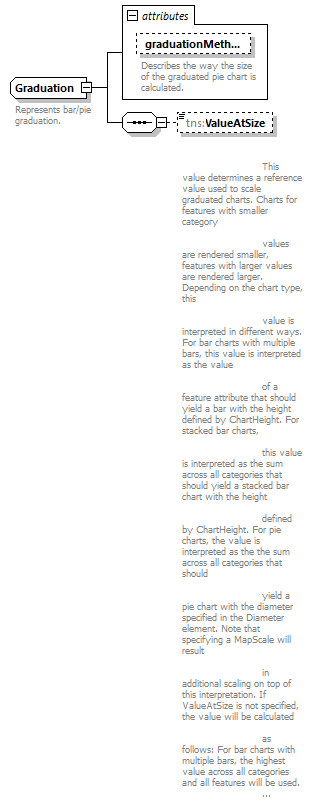
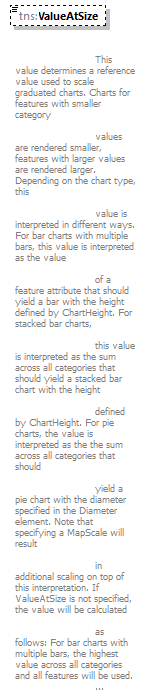
This value determines a reference value used to scale graduated charts. Charts for features with smaller category
values are rendered smaller, features with larger values are rendered larger. Depending on the chart type, this
value is interpreted in different ways. For bar charts with multiple bars, this value is interpreted as the value
of a feature attribute that should yield a bar with the height defined by ChartHeight. For stacked bar charts,
this value is interpreted as the sum across all categories that should yield a stacked bar chart with the height
defined by ChartHeight. For pie charts, the value is interpreted as the the sum across all categories that should
yield a pie chart with the diameter specified in the Diameter element. Note that specifying a MapScale will result
in additional scaling on top of this interpretation. If ValueAtSize is not specified, the value will be calculated
as follows: For bar charts with multiple bars, the highest value across all categories and all features will be used.
For bar charts with stacked bar charts as well as graduated pie charts, the highest sum of all category values across
all features will be used.


© 2007, 2020 Precisely. All rights reserved. support.precisely.com