
Using Data Quality pipelines
Click Pipelines ![]() on the sidebar menu to view existing pipelines in table format. Columns on the table show names of pipelines along with the size and number of columns in the sample data used to construct the pipelines, the number of transformation steps in each pipeline, and the associated dataset.
on the sidebar menu to view existing pipelines in table format. Columns on the table show names of pipelines along with the size and number of columns in the sample data used to construct the pipelines, the number of transformation steps in each pipeline, and the associated dataset.
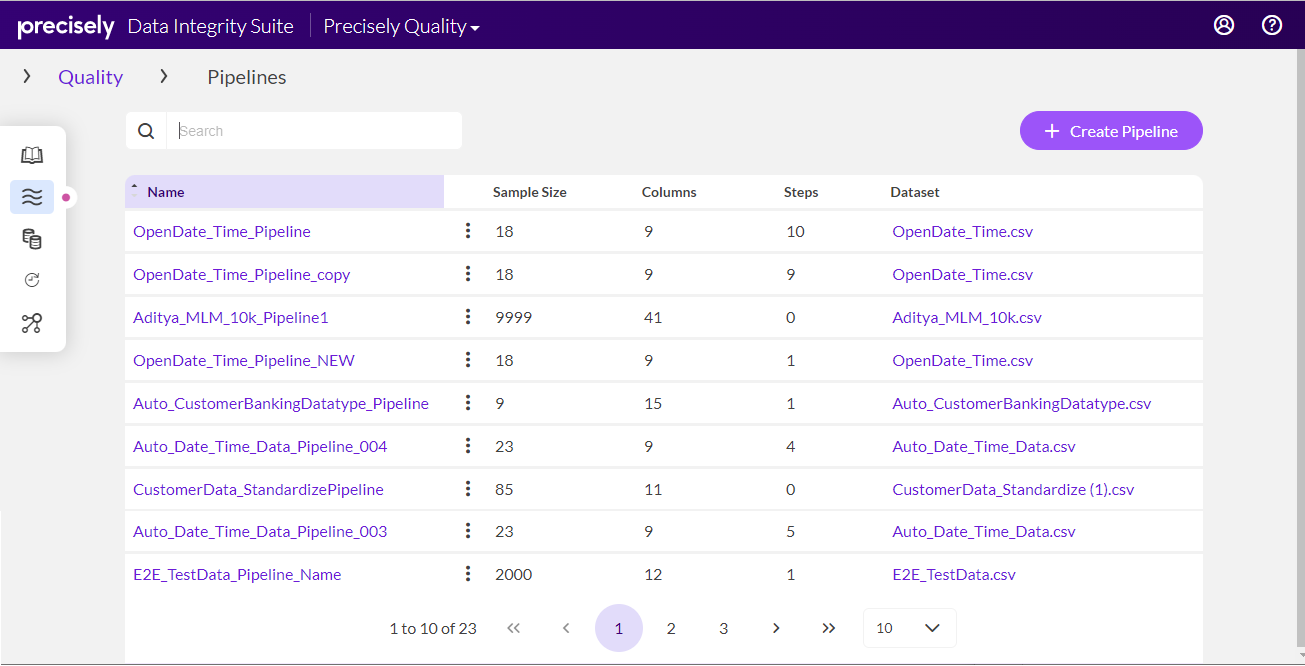
On this page you can create new pipelines and work with existing pipelines. The Create Pipeline button allows you to create a new pipeline. The shortcut menu next to each pipeline name provides commands top edit, delete, rename, or duplicate existing pipelines.
The pipeline editor is opened by clicking a pipeline name, or by clicking the shortcut menu next to a pipeline name and clicking Edit on the menu. The pipeline editor initially displaye two panels. The upper panels shows transformation steps in the pipeline. You can add, remove, or edit transformations in this panel. The lower panel displays sample data in table format.
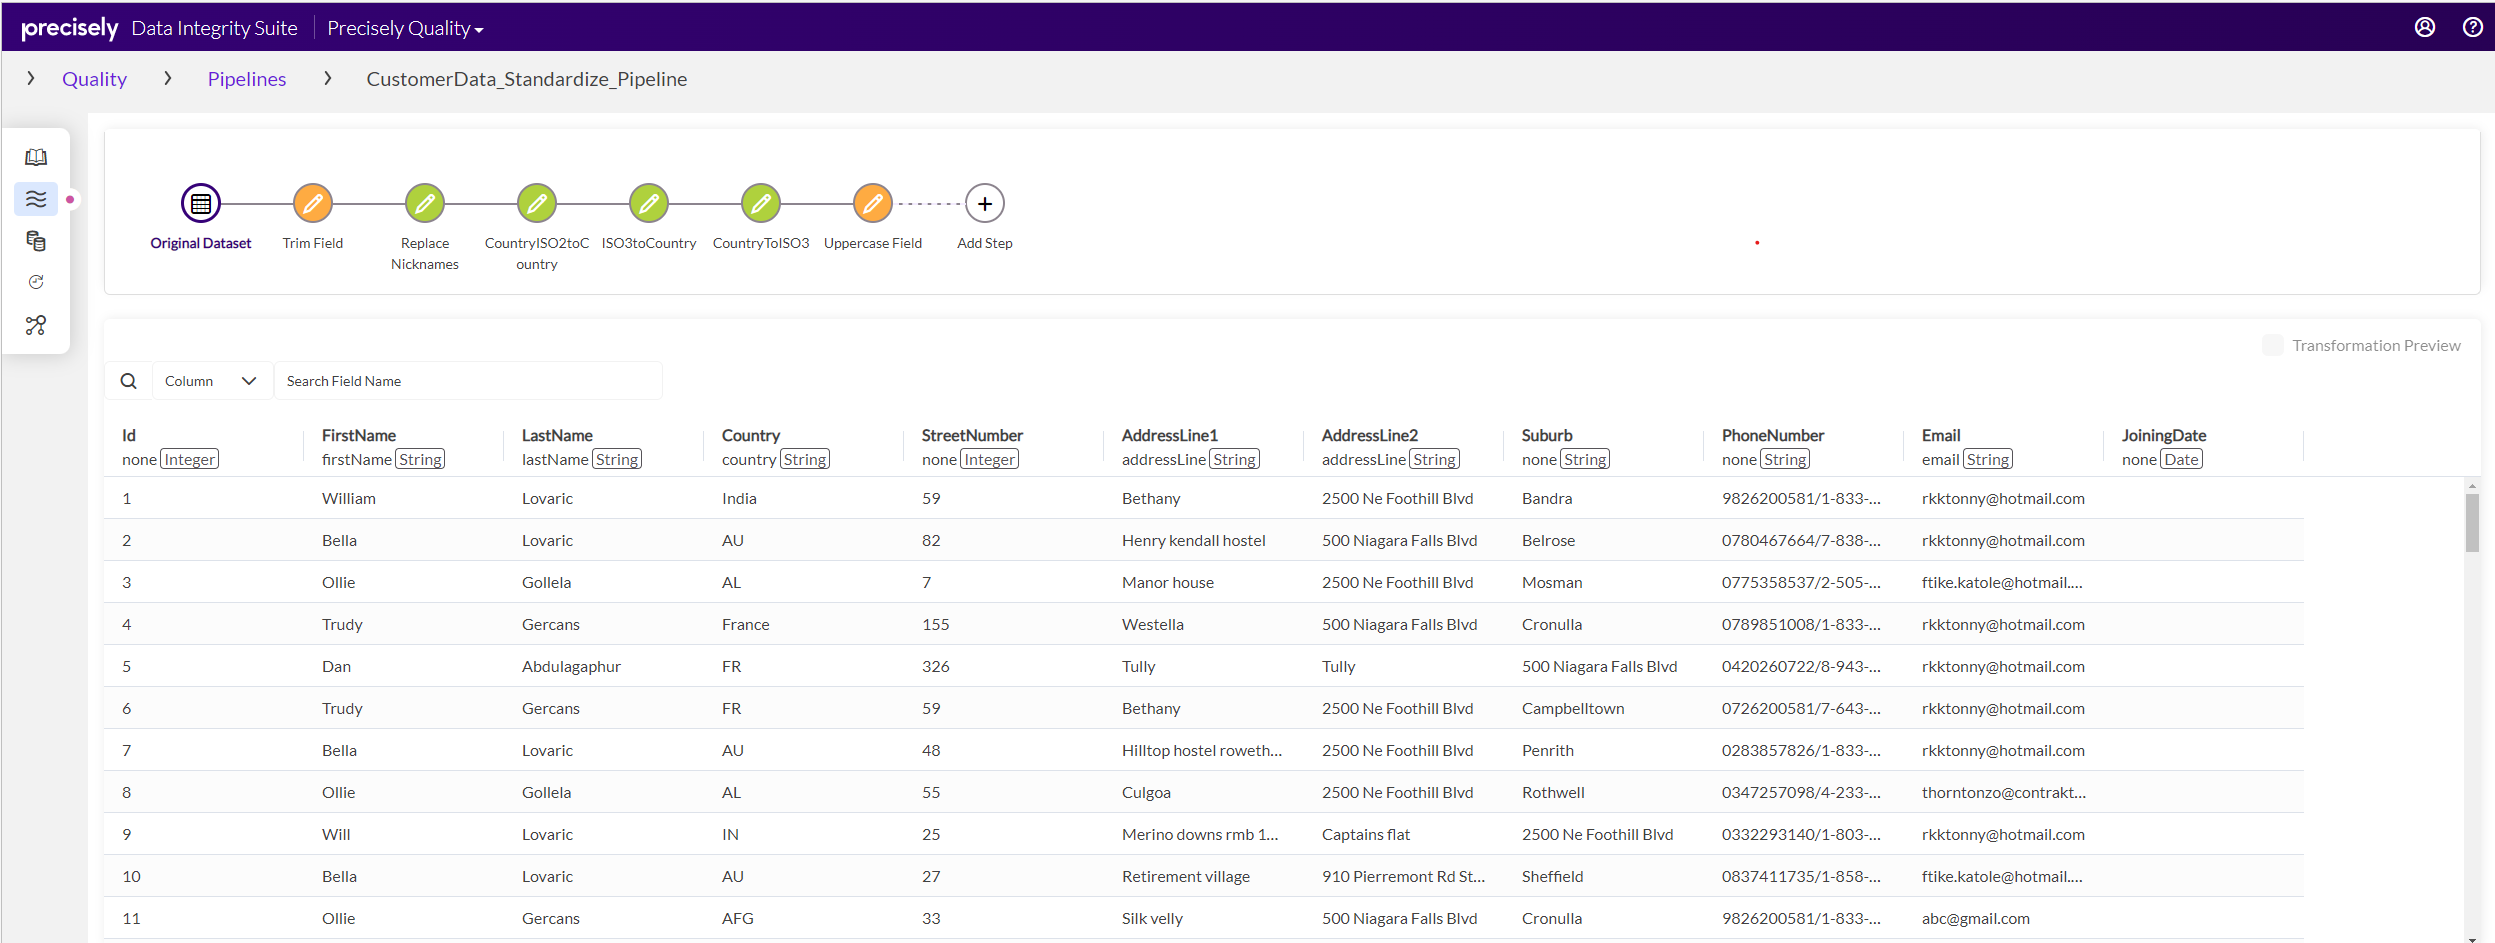
You can click a transformation step in the upper panel to highlight columns in the data affected by the transformation. Highlighted columns show data as it appears after a step is complete. When columns are highlighted you can select the Transformation Preview button to display values in the hightlighted column as they appear before and after the transformation.
You can add a new step anywhere in a pipeline—at the beginning or end, before or after and existing step, or between steps. When you add or edit a step, the pipeline editor expands a settings panel from the right side of the window.
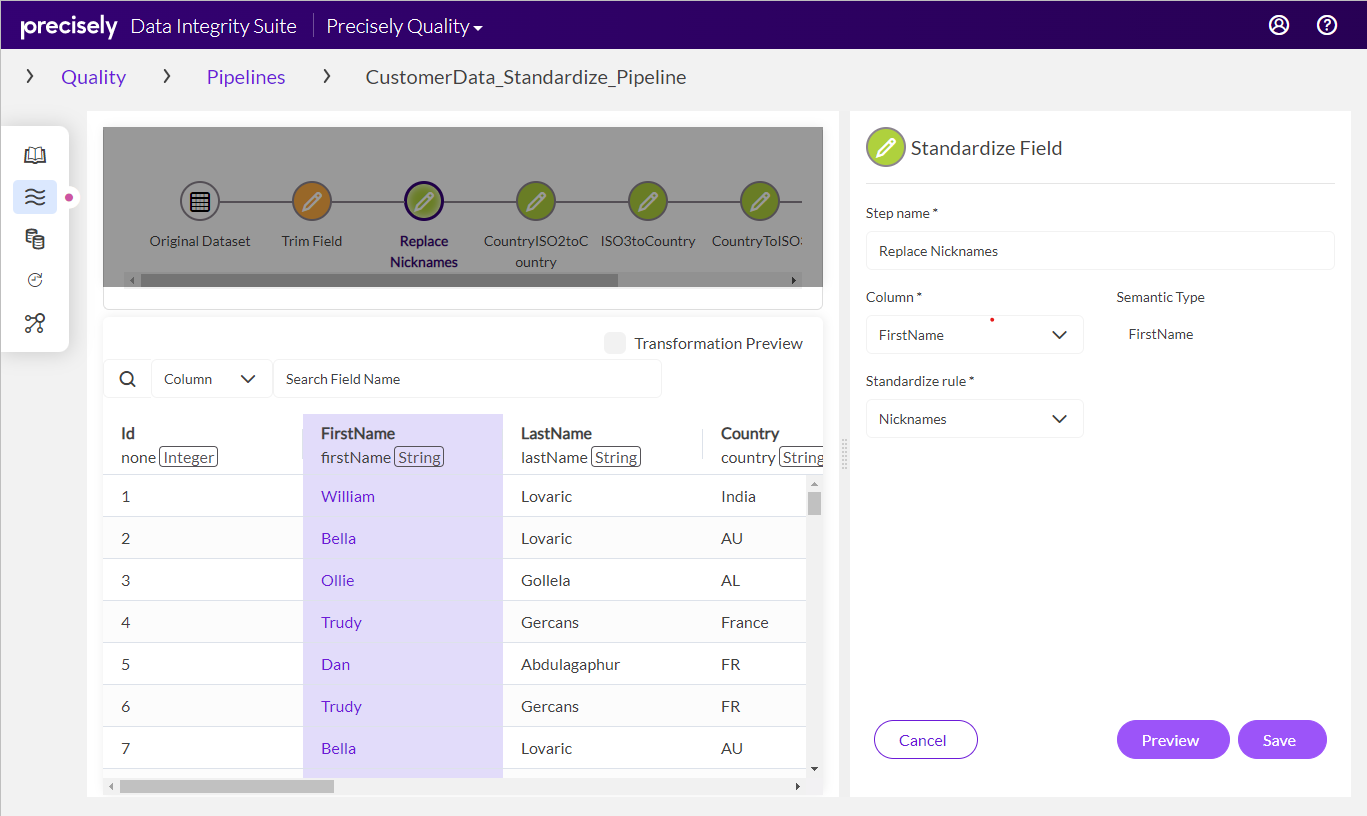
After you configure transformation options, you can click the Preview button before you save the settings to view the result of the transformation. This performs the same as selecting the Transformation Preview check box.