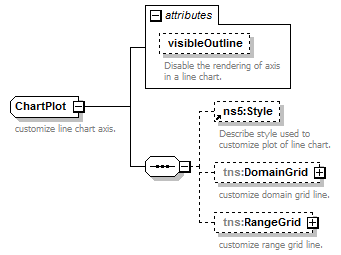
| diagram |
|
||||||||||||||
| namespace | http://www.mapinfo.com/midev/service/mapping/v1 | ||||||||||||||
| children | tns:Style tns:DomainGrid tns:RangeGrid | ||||||||||||||
| used by |
|
||||||||||||||
| attributes |
|
||||||||||||||
| description |
|
attribute ChartPlot/@visibleOutline
| type | xsd:boolean | ||||
| properties |
|
||||
| description |
|
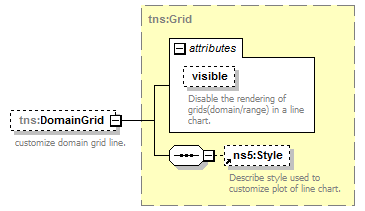
element ChartPlot/DomainGrid
| diagram |
|
||||||||||||||
| namespace | http://www.mapinfo.com/midev/service/mapping/v1 | ||||||||||||||
| type | tns:Grid | ||||||||||||||
| properties |
|
||||||||||||||
| children | tns:Style | ||||||||||||||
| attributes |
|
||||||||||||||
| description |
|
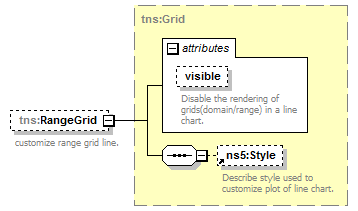
element ChartPlot/RangeGrid
| diagram |
|
||||||||||||||
| namespace | http://www.mapinfo.com/midev/service/mapping/v1 | ||||||||||||||
| type | tns:Grid | ||||||||||||||
| properties |
|
||||||||||||||
| children | tns:Style | ||||||||||||||
| attributes |
|
||||||||||||||
| description |
|