| diagram | 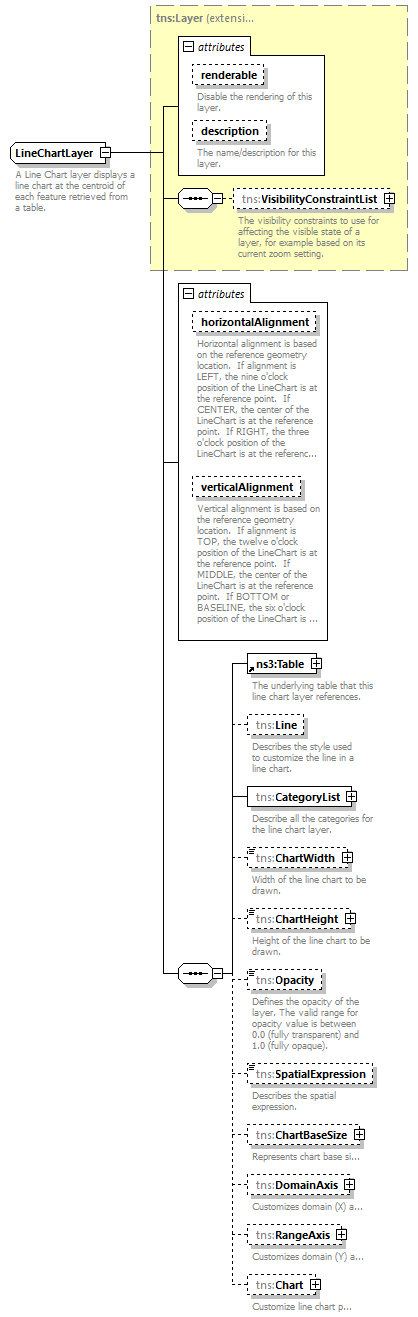 |
||||||||||||||||||||||||||||||||||||||
| namespace | http://www.mapinfo.com/midev/service/mapping/v1 | ||||||||||||||||||||||||||||||||||||||
| type | extension of tns:Layer | ||||||||||||||||||||||||||||||||||||||
| properties |
|
||||||||||||||||||||||||||||||||||||||
| children | tns:VisibilityConstraintList tns:Table tns:Line tns:CategoryList tns:ChartWidth tns:ChartHeight tns:Opacity tns:SpatialExpression tns:ChartBaseSize tns:DomainAxis tns:RangeAxis tns:Chart | ||||||||||||||||||||||||||||||||||||||
| attributes |
|
||||||||||||||||||||||||||||||||||||||
| annotation |
|
attribute LineChartLayer/@horizontalAlignment
| type | tns:HorizontalAlignmentType | ||||||||||||||||||
| properties |
|
||||||||||||||||||
| facets |
|
||||||||||||||||||
| annotation |
|
attribute LineChartLayer/@verticalAlignment
| type | tns:VerticalAlignmentType | |||||||||||||||||||||||
| properties |
|
|||||||||||||||||||||||
| facets |
|
|||||||||||||||||||||||
| annotation |
|
element LineChartLayer/Line
| diagram | 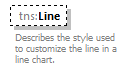 |
||||||
| namespace | http://www.mapinfo.com/midev/service/mapping/v1 | ||||||
| type | tns:Style | ||||||
| properties |
|
||||||
| annotation |
|
element LineChartLayer/CategoryList
| diagram | 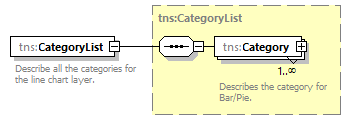 |
||
| namespace | http://www.mapinfo.com/midev/service/mapping/v1 | ||
| type | tns:CategoryList | ||
| properties |
|
||
| children | tns:Category | ||
| annotation |
|
element LineChartLayer/ChartWidth
| diagram |  |
||||||||||||||
| namespace | http://www.mapinfo.com/midev/service/mapping/v1 | ||||||||||||||
| type | tns:PaperLength | ||||||||||||||
| properties |
|
||||||||||||||
| attributes |
|
||||||||||||||
| annotation |
|
element LineChartLayer/ChartHeight
| diagram | 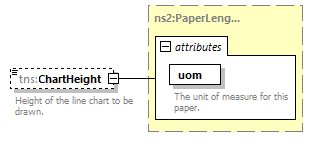 |
||||||||||||||
| namespace | http://www.mapinfo.com/midev/service/mapping/v1 | ||||||||||||||
| type | tns:PaperLength | ||||||||||||||
| properties |
|
||||||||||||||
| attributes |
|
||||||||||||||
| annotation |
|
element LineChartLayer/Opacity
| diagram | 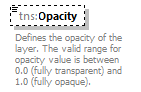 |
||||||||
| namespace | http://www.mapinfo.com/midev/service/mapping/v1 | ||||||||
| type | xsd:double | ||||||||
| properties |
|
||||||||
| annotation |
|
element LineChartLayer/SpatialExpression
| diagram | 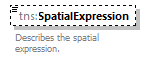 |
||||||
| namespace | http://www.mapinfo.com/midev/service/mapping/v1 | ||||||
| type | xsd:string | ||||||
| properties |
|
||||||
| annotation |
|
element LineChartLayer/ChartBaseSize
| diagram | 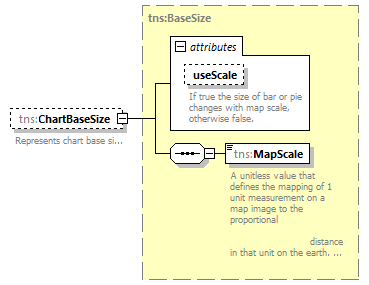 |
||||||||||||||
| namespace | http://www.mapinfo.com/midev/service/mapping/v1 | ||||||||||||||
| type | tns:BaseSize | ||||||||||||||
| properties |
|
||||||||||||||
| children | tns:MapScale | ||||||||||||||
| attributes |
|
||||||||||||||
| annotation |
|
element LineChartLayer/DomainAxis
| diagram | 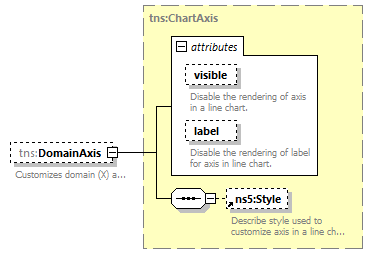 |
||||||||||||||||||||||
| namespace | http://www.mapinfo.com/midev/service/mapping/v1 | ||||||||||||||||||||||
| type | tns:ChartAxis | ||||||||||||||||||||||
| properties |
|
||||||||||||||||||||||
| children | tns:Style | ||||||||||||||||||||||
| attributes |
|
||||||||||||||||||||||
| annotation |
|
element LineChartLayer/RangeAxis
| diagram |  |
||||||||||||||||||||||
| namespace | http://www.mapinfo.com/midev/service/mapping/v1 | ||||||||||||||||||||||
| type | tns:ChartAxis | ||||||||||||||||||||||
| properties |
|
||||||||||||||||||||||
| children | tns:Style | ||||||||||||||||||||||
| attributes |
|
||||||||||||||||||||||
| annotation |
|
element LineChartLayer/Chart
| diagram | 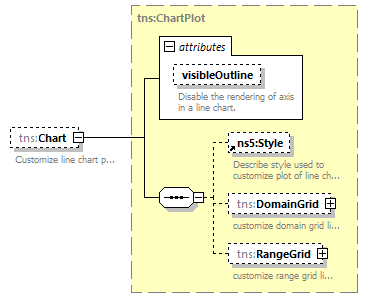 |
||||||||||||||
| namespace | http://www.mapinfo.com/midev/service/mapping/v1 | ||||||||||||||
| type | tns:ChartPlot | ||||||||||||||
| properties |
|
||||||||||||||
| children | tns:Style tns:DomainGrid tns:RangeGrid | ||||||||||||||
| attributes |
|
||||||||||||||
| annotation |
|
| © 2007, 2020 Precisely. All rights reserved. | support.precisely.com |