
Phase 2: Add Systems for IBM i LPARs
Create a System in the Configuration Tool for each IBM i LPAR to be monitored.
A separate Pipeline will be created for each system. Each Pipeline receives the monitored event and performance data from its associated component on the IBM i LPAR.
-
Click the Systems tab at the top of the Configuration Tool (as shown in Figure 1), then click the Create button to open a new system definition.
Figure 1. IBM i LPAR Configuration Parameters 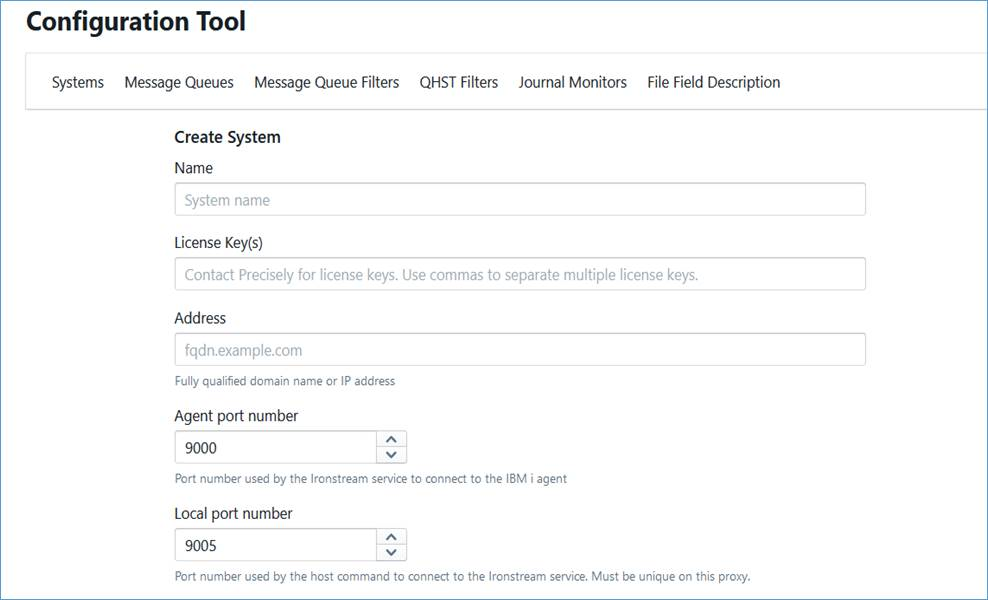
-
Complete these fields for the new system:
Field
Description
Name
Enter the name for the system definition. This will usually be the DNS name of the IBM i LPAR. These special characters must not be used for name: ( # % ) @ , = : % ; / \ |
If these characters are used, there might be a problem with clicking on Edit Pipeline button, Starting or Deleting the system.
If these characters are accidentally used, then the problem may be remediated by removing the characters from the file name of the corresponding configuration file in the conf directory.
The default location of the conf directory is C:\Program Files\Precisely\Ironstream Hub\conf on Windows and /etc/opt/OV/share/conf/vp400 on Linux.
License Key(s)
Enter the license key(s) provided by Precisely for this IBM i system.
If the LPAR is part of a Live Partition Mobility (LPM) environment, then you will need multiple license keys.
Note: You can enter the multiple license keys separated by commas. For example, keyA, keyB, keyC.For more information, see 'Obtaining License Keys' section in the Ironstream Hub Installation Guide.
Address
Enter the fully qualified domain name of the IBM i LPAR to be monitored. The name must be able to be resolved through the existing name service, for example, DNS or an entry in a Windows system’s \Windows\System32\Drivers\etc\hosts file.
You can use an IP address if the system being configured is not in DNS. It is recommended that the fully qualified DNS name be used for configuring new systems.
Agent port number
Enter the TCP/IP port number on the IBM i LPAR to which Hub will connect. The number must match the port number defined when the Ironstream Agent for IBM i library was created.
Valid values are between 1024 and 49151. The default port number is 9000.
Note: The port must be in a Listening status on the IBM i LPAR.Local port number
Enter the port number on the Hub machine server for the internal communications regarding this system.
Note: A unique port is required on the Hub machine server for each IBM i LPAR defined, and it must be open for inbound and outbound traffic.Command timeout (seconds)
Specify the time in seconds that the command entry process will wait for a command response from the Ironstream Agent for IBM i.
Log Level
Specify the granularity of the pipeline specific log tracing. The valid levels are (in order of increasing detail): None, Error, Warning, Info, and Debug.
The default is None.
Note: After installing Hub, the values in the <configuration directory>/logsettings.json file will override this setting unless <configuration directory>/ihubmain.json is configured to honor LPAR specific log settings. For more information, see Additional logging for IBM i sources.
Maximum log size (KB)
Specify the maximum size of the log file. When this maximum size is reached, the file is 'rolled'. Rolling is the process of creating a new file, closing the existing file, and writing to the new file instead. The size is specified in kilobytes.
The default is 30000 (30 megabytes).
Hub will not 'roll' logs that are less than 1MB in size so any value less than 1024KB will be treated as 1MB.
Note: After installing Hub the values in the<configuration directory>/logsettings.jsonfile will override this setting unless<configuration directory>/ihubmain.jsonis configured to honour LPAR specific log settings. For more information, see Additional logging for IBM i sources.Maximum data log size (KB)
Specify the maximum size of the file that contains the data to a File Target.
Message Queue Event Targets: Kafka|Splunk
Indicates the targets where Message Queue events will be sent. Both targets can be selected but there must be at least one target selected. A target that is selected cannot be cleared if it is the sole target.
Monitor QHST
Indicates whether the Ironstream Agent for IBM i should monitor for messages that are sent to the IBM i QHST system history log.
QHST Targets: Kafka|Splunk
Indicates the targets for QHST events to be sent. Both targets can be selected but there must be at least one target selected. A target that is selected cannot be cleared if it is the sole target. If Monitor QHST is not selected, then the targets will be disabled.
Monitor Journals
Indicates whether the Ironstream Agent for IBM i should start EVJRNPROC jobs to monitor any system or user journals on the IBM i LPAR.
Note: This checkbox option is currently ignored. If any journal monitors are defined and distributed (see Phase 4: Identify and Configure Journal Monitors), then the associated EVJRNPROC jobs will be automatically activated by the agent initialization job. To prevent the EVJRNPROC jobs from starting, delete the journal monitor members from the EVIEW/MONJRNLPRM file on the IBM i LPAR.Enable TLS encryption
Indicate if TLS encryption is to be implemented for the connection between Hub and the Ironstream Agent for IBM i. To specify the use of TLS communication, follow the steps in the chapter 'Using TLS Encryption for the Hub-to-IBM i Agent Connection' of the Ironstream Hub Installation Guide.
Certificate authority file
Specify the location of the CA file created for the TLS connection. See the chapter 'Using TLS Encryption for the Hub-to-IBM i Agent Connection' of the Ironstream Hub Installation Guide.
Message tag key
Key name of the optional JSON field to be added to messages sent to the chosen target.
Message tag value
Value for the optional JSON field to be added to messages sent to the chosen target.
Enable performance group 1 collection
Specifies whether the performance gathering function will be activated on the Ironstream Agent for IBM i to gather the data for performance group 1. See Note 1.
Performance group 1 collection interval (minutes)
Specifies the interval in minutes that the Ironstream Agent for IBM i will collect data for performance group 1. See Note 1.
Values can be in the range 1 to 525600, the minimum will be used if smaller values are specified, and the maximum value will be used if larger values are specified.
Enable performance group 2 collection
Specifies whether the performance gathering function will be activated on the Ironstream Agent for IBM i to gather the data for performance group 2. See Note 1.
Performance group 2 collection interval (minutes)
Specifies the interval in minutes that the Ironstream Agent for IBM i will collect data for performance group 2. See Note 1.
Values can be in the range 1 to 525600, the minimum will be used if smaller values are specified, and the maximum value will be used if larger values are specified.
Apply Time Zone
When checked date-times within messages will be formatted to display the offset from UTC using the RFC3339 format. For example, "2006-01-02T15:04:05+07:00" (or "2006-01-02T15:04:05Z" when UTC).
When unchecked, date-times will be displayed in the local time format: “2006-01-02T15:04:05.999999”.
Note: This option is currently ignored for System Summary Performance Data (*PERFDATA1and*PERFDATA2). These records are currently transmitted in the local time format.See Note 2.
Agent Time Zone
Date-times within messages will display the offset from UTC of the selected location.
Daylight Saving Time is automatically applied to the offset when applicable.
See Note 2.
Note 1: Collection Services can now be used to collect this performance data, therefore this is a legacy collection option which may be deprecated in a future release.
Note 2: The "Agent Time Zone" option can be used to specify the time-zone that the machine which hosts the agent resides in. The specified time-zone will only be applied to data when the "Apply Time Zone" checkbox is checked.
When the time-zone options are not set, the DATETIME fields returned in data will specify the local time on the agent but will not specify the time-zone offset from UTC. Setting the time-zone allows data across agents in multiple time-zones to be understood and use more accurately in target systems like Splunk. For example, say data is being forwarded from two agents, one on the US East Coast and the other in the UK. These systems have time-zones are usually 5 hours apart. If time-zones are not specified for DATETIME fields then an event that occurs at 13:00 local time on one machine will line up with events that occur at 13:00 local time on the other machine even though the events actually occurred 5 hours apart. When time-zones are specified then the event that occurs at 13:00 on the US machine would line up with events that happened at 18:00 on the UK machine i.e. at the same actual (UTC) time regardless of time-zone. -
Click the Save button at the bottom of the page to save the parameters for this system. The parameters will be saved locally on the Hub system.
After a system is created, it will appear in the list of systems on the Systems tab.
-
Click the Start button to start the Pipeline associated with the system. The Pipeline will only start when:
Important : Before distributing these parameters to the system, follow the steps in the section Age Limit for Journal Monitoring below, to configure the Age Limit parameter which is required for journal monitoring and not yet configurable using the Configuration Tool.
- Click the Distribute button to send the configuration parameters to the system. The EVSBS subsystem must be running on the system to receive the configuration parameters.
- If you wish to stop the collection of data at any time, click the Stop button to stop the Pipeline associated with the system.