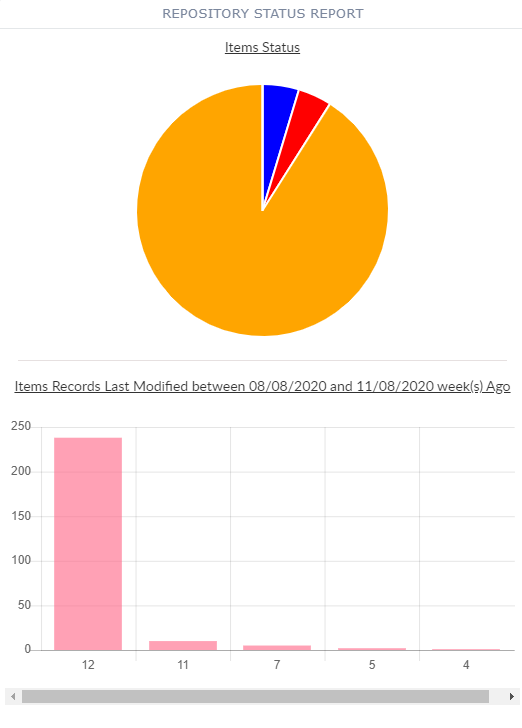
Repository Status Report Widget
The Repository Status Report widget is used to show the validation level or error status of a repository’s records. Clicking on a displayed status will cause a Repository View to open that shows the records in the repository that have that status.
The Repository Status Report widget can also be configured to show the frequency of record updates that occurred over a specified interval.
If the Repository Status Report widget is configured to show only the current status of a repository, when a status indicator is clicked, a Repository View will open for that repository and it will only show records with that status.
If the widget is configured to show both record status and the frequency of record updates, one graph will be displayed over the other. You may need to scroll down or resize your widget so both graphs are displayed.

Configuring Repository Status Widget
To configure a Repository Status Report widget:
-
Configure a new blank widget. For more information about adding and configuring new widgets, see Add a Widget.
-
Select the Settings icon
 in the upper right of the new widget’s Activity Bar. Note that a widget’s
Activity Bar will not be displayed unless the cursor is hovering over the top of the
widget. A Configuration window will appear.
 - Select Repository Status Report from the Type dropdown list on the far right of the widget Configuration window. The Repository Status Report widget configuration options will appear.
- Edit the Repository Status Report configuration options as
desired.
-
Title: The title of the widget. It is helpful if the title of a widget reflects the source of the data as well as the widget’s type, for example "Product Staging Repository Status".
-
Repository: Select the repository to be viewed.
-
Preference: (Optional) Select a Preference to be used when a Repository View is opened. If a Preference is not selected, the Default Preference will be used.
-
Saved Set: (Optional) Select a Saved Set to use.
-
Saved Search: (Optional) Select a Saved Search to use.
-
Status: If the Status checkbox is selected, the widget will display the current status of the repository's records. The configuration options for the current status will appear.
-
Type: The type of status to graph: Error Status or Validation Status.
-
Status Report Graph Type: Select the type of graph for the widget:
-
Pie: Displays a pie wedge for each type of status. The size of each wedge is determined by the number of records with the corresponding status.
-
Vertical Bar: Displays a vertical bar for each type of status. The height of each bar is determined by the number of records with the corresponding status.
-
Horizontal Bar: Displays a horizontal bar for each type of status. The height of each bar is determined by the number of records with the corresponding status.
-
Line: Line graph with the horizontal axis representing each type of status and the vertical access representing the number of records having that status.
-
-
Last Modified Interval: If the Last Modified Interval checkbox is selected, the widget will display the how many times records were updated during the indicated interval. The configuration options for the last modified interval will appear.
-
Interval: The unit of measurement for the graph to use: Day, Week, Month, or Year.
-
Start: A starting date and time. On the selector's header, click the date to use the calendar to pick a date; click the time to edit the time.
-
End: An ending date and time. On the selector's header, click the date to use the calendar to pick a date; click the time to edit the time.
-
Who: Select the user who made the changes you would like to see.
-
Interval Report Graph Type: Select the type of graph for the widget:
-
Pie: Displays a pie wedge for each frequency of record modification. The size of each wedge is determined by the number of record modifications.
-
Vertical Bar: Displays a vertical bar for each frequency of record modification. The height of each bar is determined by the number of record modifications.
-
Horizontal Bar: Displays a horizontal bar for each frequency of record modification. The length of each bar is determined by the number of record modifications.
-
Line: Line graph with the horizontal axis representing each frequency of record modification and the vertical access representing the number of record modifications.
-
-
-
-
Show Filters: (Optional.) If selected, the Filters Legend will be displayed. When displayed, clicking on a legend color will remove or add the corresponding wedge/bar/point from the graph.
-
-
Click Apply to save the changes to the widget and close the Configuration window. Click Cancel to close the Configuration window without saving the changes.
-
If you want your Dashboard configuration to remain after you switch tabs or log out, click the Save Layout button on the Dashboard's Activity Bar, otherwise your Dashboard will revert to its last saved configuration.
