Applies to:
Tools for evaluating form performance
Related topics
The following tools can help you establish a performance baseline for a solution in your environment:
Blank Composer Solution
Whether or not you have the minimum hardware specified in the previous section, you need a baseline for your environment’s performance.
Start by creating a blank Composer solution that has no rules, data connections, or Transaction/Query scripts. This may not be a realistic solution, but you can use it to get a baseline metric. It will also later help identify potential performance characteristics of your solution.
Two key performance metrics that should be obtained from this test are:
- Time to open form: The amount of time required to open the form.
- Time to submit form: The amount of time required to submit the form and return to the home page.
Each of these metrics reveals best-case performance for in the current environment given the hardware and network configuration. You can also experiment with different configurations and measure the effects on performance. For example you could add RAM and/or CPUs to each server role (specifically the SharePoint WFE and Database servers) and then monitor one or both of the performance metrics listed above.
Once you have basic performance metrics you can add one solution component at a time (data connections, Transaction/Query scripts, rules, etc.), measure the impact on performance, and determine which design decisions or desired functionality may cause improve or degrade performance for Time to Open Form or Time to Submit Form.
Ping utility
In order to use the Ping tool you must be logged into your development/QA or production servers. In some organizations this is not permitted to business users or developers. (In these cases, ask your server or network administrators to perform this test.)
- Press Windows Key+X
- Click Command Prompt (Admin)
- Type the following command: ping [server name or IP address] /t
This command will continue pinging the server until you press CTRL+C.
Once the ping stops you will see the statistics for the ping.
Ideally you should see ping times of 1ms or less for each server you ping in your Winshuttle environment. Ping times greater than 1ms may indicate issues that need to be addressed and areas where performance can be improved.
Browser Developer Tools (Internet Explorer/Chrome)
IE and Chrome Developer tools enable you to identify issues in your Winshuttle Form that could be causing performance issues. Browser developer tools can also help you understand what happens when your form is loaded and then submitted.
When using these tools it is best to get the form to the state right at the point you want to run the test, and then quickly stop the reporting right after the desired action has been tracked as finished.
For example, if you are trying to determine what is going on when a form is opened, first navigate to the location where the form is to be launched and then start the recording just before you open the form and then stop the recording after the form has loaded. This will help eliminate unnecessary noise from the results.
Common examples of what to look for when using browser developer tools:
- How long does it take to receive a response from the server after a request is sent?
- Once a response from the server is received, how long does it take to process it?
- How long and how many times is the form looping through JavaScript functions? If you have custom JavaScript in your solution and you see that function has a high number of times it is being called, perhaps it is getting stuck in a loop or the conditions of when it is being called are not specific enough to minimize the run count.
Blackbird
The Winshuttle Composer Blackbird utility is a powerful tool that can help you find performance issues in the Winshuttle application as well as bugs within your form.
To open Blackbird: Open any Winshuttle Composer form in a browser, and then press CTRL+F12.
In Composer versions 11.0.2 and prior, Blackbird does not display timestamps by default, but you can add them using the procedure below.
Adding Timestamps to Blackbird in Composer v11.0.2 and earlier:
- Update the blackbird.js files in the following directories:
- <Composer installation directory>\ js \ rt
- 15 hive of SharePoint:
C:\Program Files\Common Files\microsoft shared\Web Server Extensions\15\TEMPLATE\LAYOUTS\js\rt
- In each file is a function called "addMessage". Add a new line underneath the first one (content = ….), and put this in as a new line in that function:
content = new Date().toISOString() + ": " + content; - Save the file and close.
- After updating each file, do a full refresh on the browser and open the Blackbird window. Time stamps should now be available.
Blackbird window overview
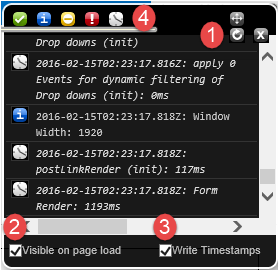
The Blackbird developer tool window

- Refresh (circular arrow) button clears the window of any existing messages.
- Visible on page load: Checking this box causes the Blackbird window to appear when the page is loaded.
- Write timestamps: Checking this box adds timestamps to the beginning of each row (if available, based on the version of Composer).
- Filter icons: Click an icon in this row to filter messages according to type (information, warning, etc.)
Blackbird debugging best practices
When using Blackbird to debug form loading issues, it is often best to do the following:
- Load the form being tested
- Press CTRL+F12 to open the Blackbird window
- Clear any messages
- Check Write Timestamps and Visible on Page Load
After this is complete, the form can be reloaded or refreshed using the appropriate icons on the browser or shortcuts on the keyboard.
These steps ensure that the messages in the window are only pertinent to the form load and do not contain messages from any previous actions. You can then review the messages in the Blackbird window to determine for any issues.
Tip: Copying the message out of the window and pasting them into a document editor such as NotePad++ often makes reviewing the messages easier to find any issues that may be present.
What to look for
- Looking for any drop downs that are taking a long amount of time to load compared to others.
- Scanning down the timestamps to visually notice large gaps between time stamps.
- Counting the number times rules are run on a particular field. A high count could indicate circular change loops or conditions not being set correctly to minimize the number of times rules are fired.
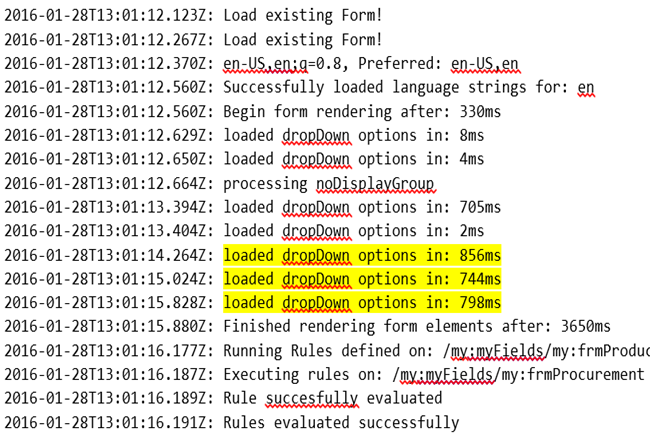
At right: A snippet from the Blackbird window when a form was loaded.

Notice the highlighted drop down fields are taking nearly one second to load.
This is not a long time by itself, but when compiled with several other drop downs that take this time, it starts to add up.
See Troubleshooting forms and improving performance for tips about troubleshooting form performance.
Generally, there is no single solution that will solve a problem, but these tools can assist you in determining the current state of the system and where there are opportunities for improvement, both inside and outside the Winshuttle solution.
For example, having the data that shows poor response times when pinging servers can help direct your management to make network administrator resources available to help fine tune this portion of the system while you focus on optimizing the design of your Winshuttle solution.