Applies to:
- Winshuttle Foundation
Debugging rules and/or Javascript
JavaScript reference guides
Below is some general information for debugging custom Javascript in Composer.
Accessing browser developer tools for debugging
Chrome
- Developer tools: From the Main Menu: More Tools > Developer Tools
- Chrome Developer Tools help
Firefox
- Developer Tools: From the Main Menu > Developer > Debugger
- Firefox Developer Tools help
Internet Explorer
- Developer Tools: From the Main Menu: F12 Developer Tools
- Internet Explorer Developer Tools Help
Accessing the Debug logger in Composer
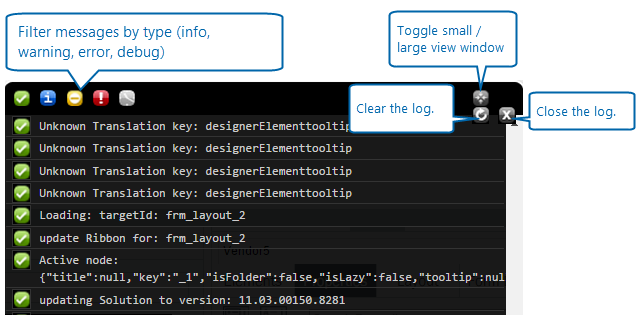
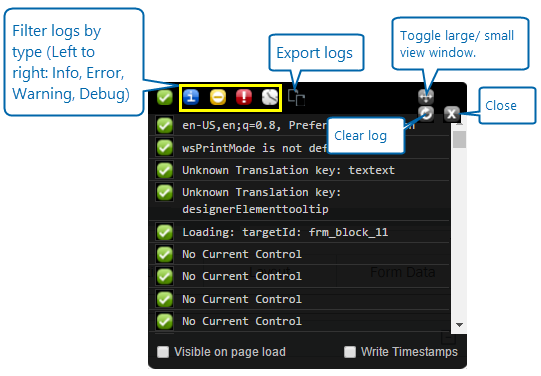
In Composer, you can press CTRL+F12 to open Blackbird, a free, 3rd-party plugin that you can use to view and help debug your Javascript.
The Filter icons filter the log entries by type (Informational, Error message, Warning, or Debug)
The Export Logs button opens a window with the log file content already highlighted so you can easily copy and paste it into a text editor.

